RASI or Classic - Which Summation Is Better?

Free Chart In Focus email
Delivered to you every week
One of the questions we receive often is about the difference between the old fashioned McClellan Oscillator and Summation Index versus the newer "ratio adjusted" variants. People want to know why there are two versions, and which is better.
It is much easier to explain the need for different versions than to say which is better. Over time, the number of issues traded on both the NYSE and the Nasdaq have changed quite a bit. Having more issues means that indicators tied to daily breadth numbers will see greater amplitudes of movement. Back in 1970, when Sherman and Marian McClellan introduced their indicators to the world, no one contemplated the sort of expansion in issues traded. Years later, it was clear that something had to be done to adjust for the increase in issues traded.
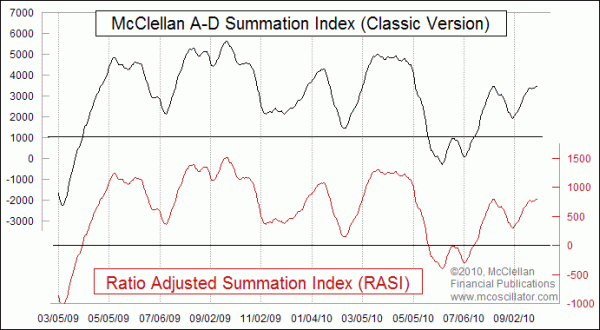
This week's chart looks at a comparison between the "classic" version of the McClellan Summation Index and the newer Ratio Adjusted Summation Index (RASI). On the chart, the two plots look almost identical. The only difference is in the scaling of the vertical axes. For a limited time period like the one shown in this chart, it does not really make much of a difference which version one examines, since the patterns in the chart behavior are the same.
But if one wants to make longer term comparisons, then the growth in listed issues starts to become more meaningful. For that reason, long term analysis of Summation Index behavior is better done with the RASI than with the classic version, because we can better factor out the changes in amplitude caused by changes in the number of issues trading.
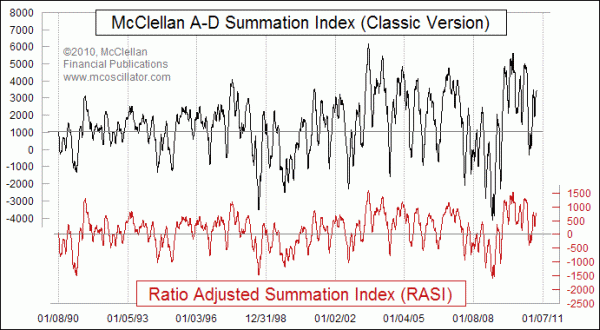
The chart below shows the same two indicators going back to 1990. You can see that there has been a big increase in amplitudes in recent years versus what we saw in the 1990s. But the movements of the RASI do not look much different now from the way that they behaved 10-20 years ago, at least in terms of the amplitudes.

So in conclusion, one can make a mental adjustment for the changing number of issues and continue using the classic Summation Index. Or one can make a mathematical adjustment and use the Ratio Adjusted Summation Index. Which one is better depends upon the conclusions and interpretations one makes from examination of the chart patterns, and on the time frames involved.
Read more about the RASI's calculation method
Read more about calculating the McClellan Oscillator and Summation Index
Tom McClellan
Editor, The McClellan Market Report
Jan 01, 2010
Nasdaq A-D Line “Divergence” |
Nov 20, 2009
NDX A-D Oscillator |
Aug 21, 2009
Strong RASI Promises Higher Price Highs |