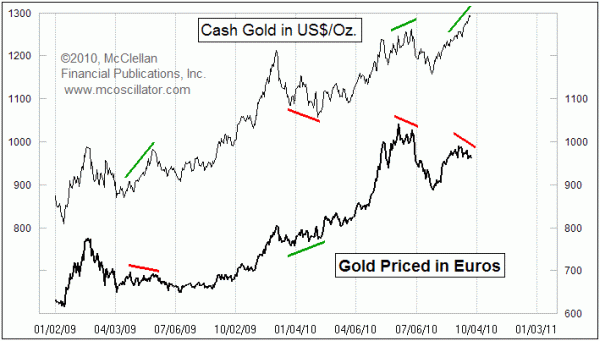
Gold Priced In Euros Pointing Downward

Free Chart In Focus email
Delivered to you every week
Gold traders are excited about seeing the spot price touch $1300/oz for the first time. But gold traders who operate in the euro currency do not perceive the same price behavior.
This week's chart compares the dollar price of gold to the euro price. The most obvious feature of this comparison is that while gold in dollars is making higher highs, gold in euros is making a divergent lower high.
For much of the time, the two price plots tend to move in synchrony without displaying a detectable difference in behavior. This is especially true during rare periods when currency movements are minimal. If the exchange rate of dollars to euros were always the same, then there would be no difference in the price structure of gold as measured in one currency or the other. But when the exchange rate moves, that is when we see differences in the gold price behavior in each currency.
The important point about seeing the current divergence is that when we have seen similar divergences in the past, it is usually gold's euro price plot which knows the real story about the future direction for both. The most recent significant top for gold prices in late June 2010 saw a higher dollar price and a lower euro price. What followed was a selloff of 8.2% for the dollar price, and 13.4% for the euro price, measured from the June 28 high.
Examining the two price plots does not always give us such clear indications of differing behavior. When gold prices topped in December 2009, the two currencies showed a coincident price top for gold. So we do not always get information like this. This is not unusual, since just about any technical indicator or methodology will go through periods when it does not give useful signals. The key is to learn to listen when good indicators give us good information.
Right now, the divergence is saying that gold prices should start to head lower soon. How soon that move starts is a question for another technical discipline to answer; this relationship just shows a divergence which represents the potential for movement. We also do not know how long such a move would last, which is why it pays to observe a variety of indicators for any price series, as we do for readers of The McClellan Market Report and Daily Edition.
Tom McClellan
Editor, The McClellan Market Report
Jan 08, 2010
The One Real Fundamental Factor Driving Gold Prices |
Dec 04, 2009
How Gold Forms Tops |
Nov 13, 2009
Oil Prices Look Different in Euros |