Copper Breaking Its Correlation

Free Chart In Focus email
Delivered to you every week
It was a fun correlation while it lasted.
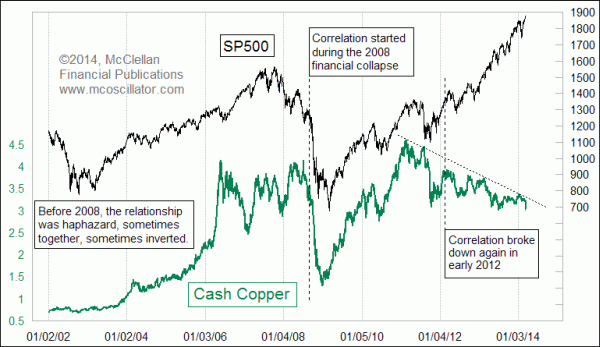
From 2008 to early 2012, copper prices displayed a very strong correlation to the movements of the SP500. Even more importantly, whenever copper prices would show a sign of weakness that the SP500 did not show, it was nearly always the case that copper ended up being proven right about where both were headed, as I discussed here.
Prior to 2008, the relationship was decidedly mixed. Sometimes copper prices would move in sync with the SP500, and sometimes they would move in opposition. The financial crisis in 2008 seems to have jolted the two into a strongly positive correlation, at least for a while. But now it appears that the two have decided to dance apart once again. Perhaps it was not a relationship which was meant to last.
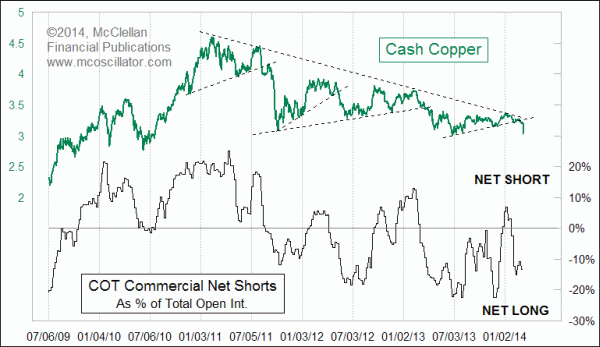
Or perhaps copper still knows the real deal, and the stock market is just zooming higher on its own, oblivious to any real economic problems thanks to the Fed keeping the financial sugar water flowing. Copper prices have just recently had a big breakdown, taking the price of copper futures below the magic round number of $3.00 per pound. Crossing below $3 got a lot of traders' attention. Stock prices do not seem to have paid much notice, at least not yet.
At the moment, there does not seem to be the right condition for a copper price bottom, at least not just yet. Commercial traders of copper futures are net long as a group, but not to a huge degree:

For copper to break an uptrend line as it just has just done, that seems to suggest a meaningful drop for copper prices. Such a drop is unfolding now.
The commercial traders are presumed to be the smart money, and they are not yet at a big enough net long position to mandate an upward reversal just yet. They could easily get to such a state in another week or two, or perhaps longer. But they are not telling us now that a reversal absolutely has to happen. They usually get positioned ahead of a big move, and so that seems to be what this half-hearted net long position is saying; they are getting ready for what is coming, but it is not coming just now.
The COT Report data on the various trader category positions is something I cover every Friday (the day when the COT Report comes out) in our Daily Edition. It is a useful way to keep tabs on what the sentiment of the futures trading community has to say about the various markets.
Tom McClellan
Editor, The McClellan Market Report
Dec 30, 2011
Copper Weakness Is a Warning Sign |
Feb 13, 2014
Can Earnings Get Better Than This? |
Nov 07, 2013
Housing Stocks To Pop Up Into 2014 |