Flat M2 Growth Means Flat Period For Stocks

Free Chart In Focus email
Delivered to you every week
Part of the Fed’s response to Covid-19 in 2020 was a dramatic increase in the money supply, pushing up the money supply measure known as M2 at the fastest rate in the history of record keeping. That rise was already underway when Covid hit, and the Fed’s actions just boosted it some more. Not surprisingly, we are seeing consumer price inflation now, because the price of anything is a measurement of money per unit of stuff. If the money increases dramatically but the amount of stuff stays the same or goes down, then the money/stuff ratio has to adjust.
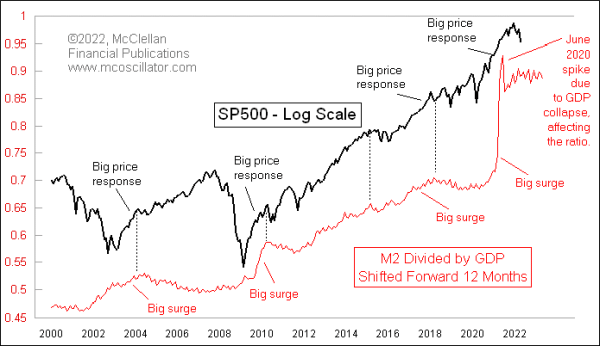
M2 has an important relationship also with the stock market, but teasing that out takes a couple of tweaks. This week’s chart adjusts the raw M2 data by dividing it by GDP. If the money supply is increasing at the same rate that GDP is growing, then this line goes flat, which is the condition we are seeing right now. The other tweak is that I have shifted forward the plot of M2/GDP by 12 months, to reveal how big changes in that ratio tend to get echoed a year later as big moves in the stock market.
That is true at least for the big upward surges in M2. We don’t see big downward moves in M2/GDP, and yet we do see big bear markets for stocks. So M2 does not explain everything. But it is fair to say that when there is a big surge upward in M2/GDP, we see a big surge for stocks about a year later. And we saw that this time, with the big bull market following the March-April 2020 Covid Crash.
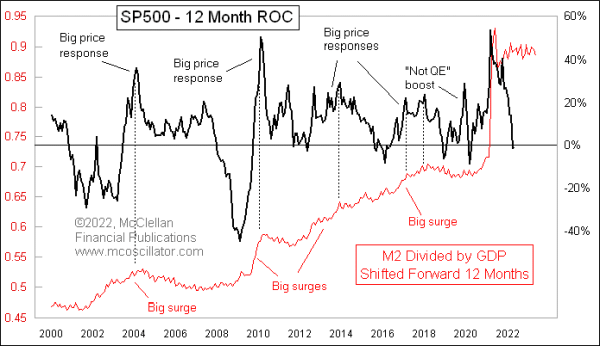
Now we are in the “expired growth” phase, when the flat M2/GDP ratio says no more big party for the stock market. This can also be seen when we look at the 12-month rate of change (ROC) of the SP500 versus the M2/GDP ratio. The same 12-month offset works here too:

The big upward surges in the M2/GDP ratio reliably lead to big surges a year later for stock prices. And then when the punchbowl gets taken away, the party falls flat. We have at least a year of a non-partying environment for the stock market.
It is worth noting that this relationship has not always worked this way. Back in the 1960s it was more of a coincident relationship. In the 1980s and 1990s, that shifted to a 6-month leading indication, and now it is out to 12 months. I cannot explain that shift, but it is detailed in this prior article.
Someday in the future, the Fed will again decide to goose the money supply over some unknown emergency, and we will get another big stock market response. But that day is not now.
Tom McClellan
Editor, The McClellan Market Report
Feb 11, 2021
Understanding M2 and Stocks |
Mar 23, 2012
SP500 Undervalued Versus M2 |
Apr 02, 2021
Clarifying Oil’s 10-Year Message For Stocks |