Gold Breaks Downtrend, Sort Of

Free Chart In Focus email
Delivered to you every week
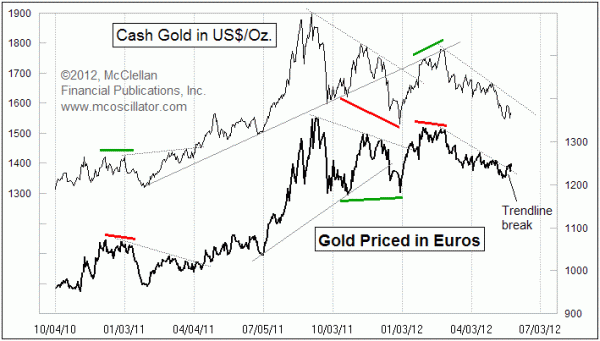
American gold traders see gold prices in a downtrend, and wonder whether the December 2011 bottom will hold as a support level. There is not much to like in the chart of gold prices, as priced in U.S. dollars.
But European gold traders see a much different picture. The chart plot of gold prices measured in euros has now broken its declining tops line, and appears to be in a much more favorable configuration.
So who is right?
Generally speaking, when the dollar price of gold disagrees with the euro price, it is usually the euro price plot that ends up being correct about where both are heading. So there is important information to be gained by not just looking at each price plot, but also comparing the two.
These differences in behavior show up most obviously in the form of divergent tops or bottoms. If the dollar price of gold makes a higher high, for example, while the euro price makes a lower high, it is time to worry.
But differences in behavior can also show up in a more subtle way, and that is what we are seeing right now. The dollar price of gold is still in a downtrend, but the euro price has already broken its equivalent declining tops line. Generally speaking, the breaking of trendlines like this in the euro quite often precedes the breaking of the equivalent line on the dollar price chart.
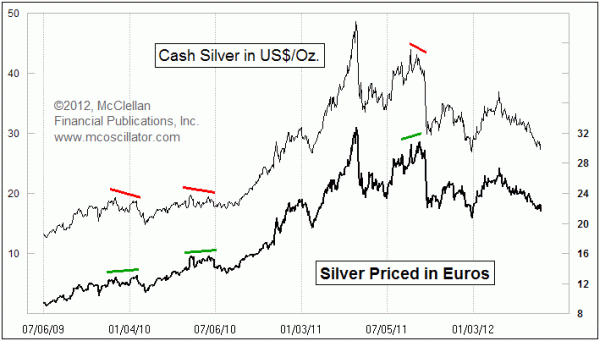
Interestingly, this same principle does not work for some reason when we look at silver prices in each currency. Silver prices generally move in sympathy with gold prices, but silver tends to be more volatile than gold, and thus it tends to attract the "hot money". I like to say that it helps to think of gold as the dog, and silver is the tail of the dog. The tail is going to go wherever the dog goes, but it will follow along much more excitedly.

Because silver trades with so much greater volatility than gold prices, it is harder to see the differences in the price plots that are caused by currency translations. There is just not as much of a difference than what we see in the gold price charts. When divergences appear, it is usually at price tops, and here we see the big difference in behavior. For silver divergences, for some reason it is usually the dollar price plot that tells the truer story about where both are headed.
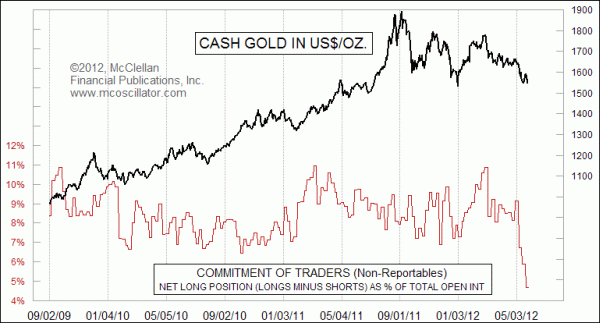
Coming back to gold, this sign of a downtrend break in the euro price of gold arrives at a time when investor sentiment toward gold is at a bearish extreme.

This final chart looks at data from the weekly Commitment of Traders (COT) Report. The non-reportable traders are owners of futures contracts whose total position size is considered by the CFTC to be so small that they are not worth having those positions reported individually. They are considered to be the small-time speculators, and thus the opposite of the presumably "smart money" commercial traders. The recent data show that this group of traders is at its lowest net long position in years, as they are expressing a more bearish view toward gold. Seeing the small speculators get scared out of the gold market is a sign that the mission of the downtrend is about done.
Tom McClellan
Editor, The McClellan Market Report
Feb 04, 2011
Gold ETF Assets |
Sep 24, 2010
Gold Priced In Euros Pointing Downward |
Nov 18, 2011
One to Three Years Left For Gold’s Run |