Gold’s 8-year Cycle

Free Chart In Focus email
Delivered to you every week
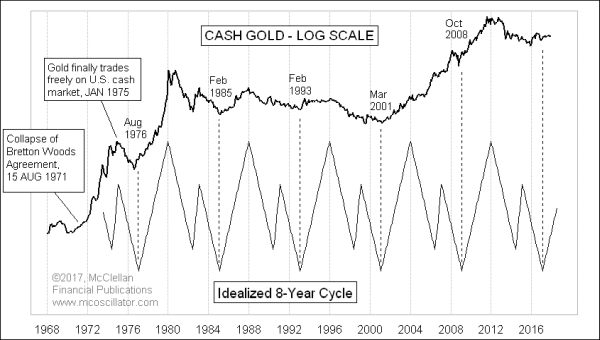
We are now entering the upward phase of gold’s 8-year cycle, and that should bring some fun gains. And this comes at a time when gold has not been getting much of investors’ attention. If gold stays flat for a year, and Bitcoin twinkles to get all of the attention, speculators eventually drift away from gold. That sets up a great opportunity for gold to start getting more attention, and more money thrown its way.
As with most market cycles, gold’s 8-year cycle is measured bottom-to-bottom. But there is more to it than just that 8-year period between major bottoms. It typically sees a 3-year upward phase, which is where most of the big gains are seen. Then the 5-year downward phase actually has a 3-wave process of going down.
This has been evident since shortly after gold started trading freely in 1975. The cycle was probably lurking out in the wild, but it was just not evident with the Treasury department fixing gold prices prior to the 1970s. The 3-up, 5-down pattern saw one anomaly in the 2000s, when prices were mostly up all the time during that cycle. But if you look hard enough, you can see the inflection points of the 3-wave down move within that upward trend.
Now that we are in the 2010s, the pattern appears to have returned to its normal 3-year up, 5-year down phase, and reset for the next 3-year up phase. So why has gold not started screaming higher already?
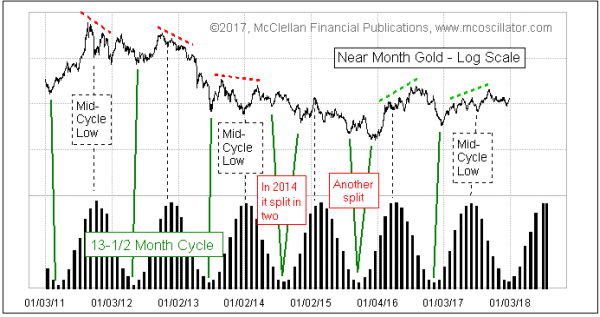
My answer is that there is another independent cycle also at work that has kept gold price down in late 2017, and that is the 13-1/2 month cycle.

This cycle is also a bit unusual, in that it usually contains a mid-cycle low about halfway between major cycle lows. And as I discussed back in September, it is a bullish message to see “right translation” in the last cycle.
That term means that the price high after the mid-cycle low is higher than the one before it. Seeing right translation means that prices should not go down to exceed the prior major cycle low, and that they should do well in at least the first part of the next cycle, which is starting right about now. We saw “left translation” in the 13-1/2 month cycle from 2011 to 2014, as gold prices were in a protracted downtrend during the 8-year cycle’s descending phase.
As we head into early 2018, we have both the 8-year cycle and the 13-1/2 month cycle in their ascending phases. That means both horses are pulling in the same direction, and it should mean good things for gold prices especially in the first half of the year.
Tom McClellan
Editor, The McClellan Market Report
Sep 07, 2017
Gold’s 13-1/2 Month Cycle: Right Translation |
Dec 10, 2016
Bonds and Gold in Unusual Correlation |
May 19, 2016
Major Cycle Low Upcoming in Gold |