Architecture Billing Index Shows Continued Growth

Free Chart In Focus email
Delivered to you every week
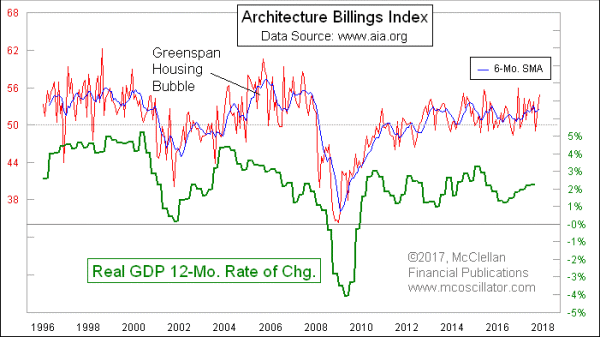
The folks at the American Institute of Architects, www.aia.org, publish an interesting set of data each month, collectively known as the Architecture Billing Index, or ABI. The main ABI represents actual billings that member firms have sent out in the previous month. They also have an “Inquiries Index”, which measures potential business as opposed to actual business.
The reason why I find examining the ABI so useful is that it correlates pretty well with GDP data, and we get the ABI data well ahead of the GDP numbers, which only come out quarterly and which take several weeks to tabulate before they are released.
The latest release out this week showed a value of 55 for the ABI, which is the 4th highest monthly reading since the 2009 depression. It says that there is strong demand for architectural services, which is a forerunner of actually building a new home or other type of building. The implication is that there is no slowdown to the building boom going on now, at least as far as such a slowdown might show up in the architectural services part of that market.
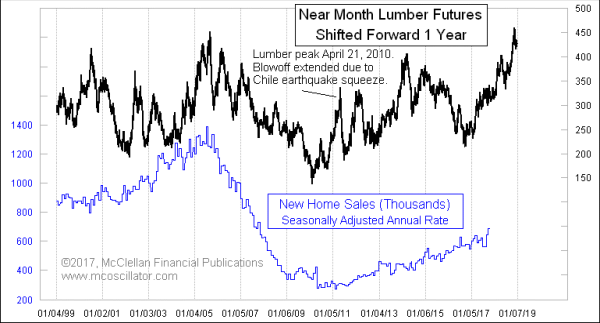
This fits well with what we already know from the rise in lumber futures prices. Lumber gives about a 1-year leading indication for a lot of economic data series, including short term interest rates and housing data. This next chart shows how the numbers for New Home Sales tend to follow the movements of lumber prices with a lag time of about a year.

Lumber prices have been trending higher over the past year. The last push up to a new all-time price high was admittedly helped by the hurricane damage in Texas and Florida, so we maybe should not believe in the entirety of its message. A similar blowoff in lumber prices occurred in 2010, after an earthquake in Chile disrupted the lumber market for both North and South America, in a way that was not really replicated in the New Home Sales data.
But the portion of lumber’s uptrend which preceded the hurricanes’ damage was real market demand, and ought to flow through into the housing market data. So far, we are not seeing anything to indicate otherwise, including from the ABI numbers.
Tom McClellan
Editor, The McClellan Market Report
Feb 19, 2015
Architecture Billings Index Flashes Warning |
Jun 10, 2011
Architecture Billings Index Forecasts The Economy |
Dec 15, 2016
Lumber’s Message For Interest Rates |