Architecture Billings Index Flashes Warning

Free Chart In Focus email
Delivered to you every week
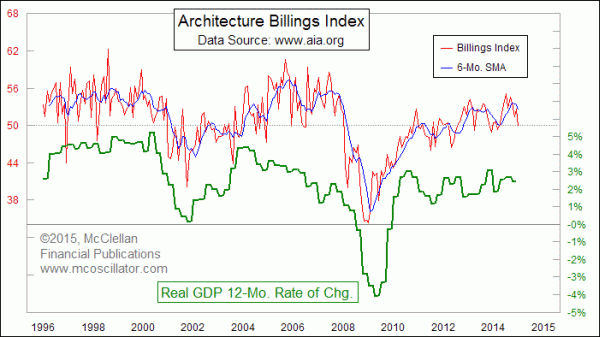
The latest news from the American Institute of Architects (AIA) has some economists alarmed, because it shows a potential shrinkage in housing related activity. The AIA publishes data based on surveys of member firms, known as Architecture Billings Indices, and their two main index products are the Billings Index and the Inquiries Index. Billings represents actual work that gets billed to the customer, while Inquiries is a softer data set reflecting customers potentially generating new work.
It is the actual Architecture Billings Index (ABI) which has dropped below its 50 level, showing a contraction in activity. The Inquiries Index data are still up, but that is not necessarily a good thing when the Billings Index is falling.
The reason why this is important for economists is that a shrinkage in activity at architecture firms is often a leading indication of a shrinkage in the overall economy. And given the lag in reporting of actual GDP numbers, the ABI data can give us a big hint about what is coming for the next quarterly GDP report.
One month’s reading below 50 for the ABI can be misleading, because it could be affected by noise, or bad weather. So seeing a single reading below 50 does not necessarily mean that it is time to go running around shouting that “the sky is falling”. Instances of multiple months’ readings below 50 have a better track record of signaling trouble for GDP.
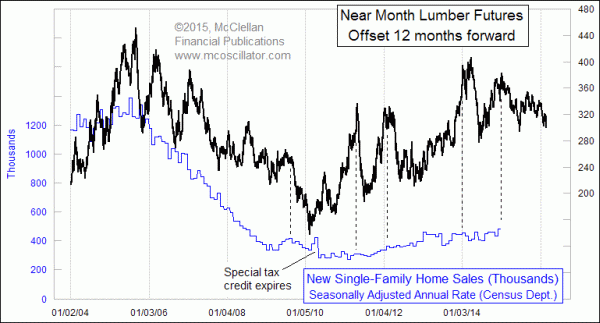
In the current case, though, we have already seen an even better leading indication foretelling trouble in the housing sector, and thus in the economy. I have found that lumber prices give a 1-year leading indication for housing activity.
The chart below compares lumber prices to New Home Sales data from the Census Department. The trick is that the lumber price data are shifted forward by a year to reveal how lumber prices lead what happens in the housing market.

The implication is that home sales follow what happens to lumber prices. And since we are now at the 1-year anniversary of an important top in lumber prices, the expectation is that home sales numbers should be flat to downward in 2015.
Some people will blame the east coast winter storms, and others will blame the west coast port strikes or the Federal Reserve. But regardless of who gets the blame, lumber prices seem to have already understood what is coming, and what the ABI numbers are just now starting to show.
Tom McClellan
Editor, The McClellan Market Report
Oct 25, 2012
Architecture Billings Index says Q3 GDP should be muted |
Jun 10, 2011
Architecture Billings Index Forecasts The Economy |
Nov 14, 2014
More Good News for Employment |