Gold’s Dollar-Price Breakout Started With A Yuan-Priced Breakout

Free Chart In Focus email
Delivered to you every week
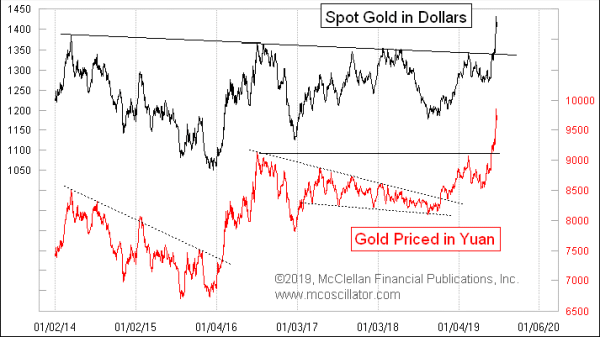
Gold prices shot higher starting on June 14, once the dollar price of gold cleared the Feb. 20, 2019 high at 1343.70. That brought out the momentum chasing buyers, or at least it brought out those who think in dollars.
But a breakout to a higher high had already taken place if you look at the spot price of gold as measured in the Chinese yuan. It moved above its equivalent high on June 3, almost 2 weeks before the dollar price’s breakout.
Traders and investors in the USA are used to looking at everything in dollar price terms, because that is what matters for their trading success. We buy and sell in dollar terms, and our success or failure is measured in those terms. So it is natural to think in those terms. But it may not be the best way to get answers about what prices are doing, and what they are going to be doing.
This week’s chart is about learning to see gold prices in a different way, and in a way that may arguably be more important for chart analysis. The trendline breakouts on the yuan price plot seem to come ahead of the equivalent ones on the dollar price plot. So if you want to know what is going to happen to gold as priced in dollars, you can sometimes get a really big hint from the yuan price of gold.
One additional interesting point about this comparison is that the big dollar price decline in gold during the middle of 2018 was not really reflected in the yuan price. The yuan price just chopped quietly in a very tight descending triangle structure, until the point when it decided it was ready to get started moving higher.
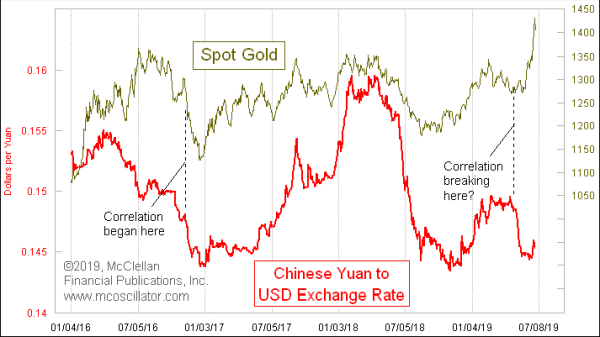
This relationship merits further contemplation in terms of what we see in the lower chart.

From late 2016 until just recently, the yuan to dollar exchange rate has been doing a pretty good job of matching the movements of the dollar, with a very strong pattern correlation. That correlation just recently broke down, when the yuan dropped back down to seek support at around the 0.144 level (~6.90 yuan/dollar). Exactly why the yuan fell out of correlation to the dollar price of gold is not clear, but that moment when the correlation was broken coincided with the start of the launch higher for gold prices which led to its breakout in both currencies.
The trade negotiations between the USA and China are assuredly a part of the ongoing drama in the yuan, and those negotiations are a topic beyond my set of skills to forecast. The important point to take away from this now, though, is that looking at prices only in dollar terms can lead a chartist to miss the developing story which is evident elsewhere.
Tom McClellan
Editor, The McClellan Market Report
Sep 20, 2018
Gold Now Bound to the Yuan |
Jan 04, 2018
Gold in Euros Not Confirming |
Dec 10, 2016
Bonds and Gold in Unusual Correlation |