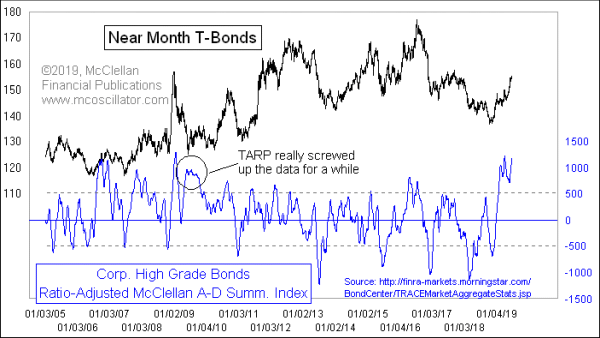
High Grade Bond Summation Index
Free Chart In Focus email
Delivered to you every week
The Treasury Bond blowoff which is currently underway is dragging along the high-grade corporate bonds due to the coattails effect. That is leading to really strong numbers for the Advance-Decline statistics for these corporate bonds, which has driven up the Ratio-Adjusted Summation Index (RASI) for these bonds to a really high level.
When it comes to the stock market, a really high RASI for the NYSE is great news. It says that strong upward initiation of an uptrend has taken place, and it promises us further gains yet to come in the weeks and months ahead.
But it does not work the same in the bond market. Stocks make spike bottoms and rounded tops; there are no real blowoffs in the historical record for the overall stock market, although there was one for the Nasdaq back in 2000 which was a rare exception. But the bond market DOES see blowoff price tops. So when there are really high RASI readings like what we are seeing now, they are usually associated with important price tops for T-Bonds.
This is somewhat counterintuitive. Why should the same indicator have different rules of interpretation for the stock market and for the corporate bond market? Markets should be markets, and the rules should be the same, dammit!!
But that is a procrustean view. That is telling the market how IT should behave, rather than listening to the data and learning how to accept their messages. It is not our place to tell the stock and bond markets how they are supposed to behave. Our job is to figure out the rules that they follow, and see where those rules can perhaps give us an edge.
Right now, the message is that everyone is mad for T-Bonds and piling in like crazy. That sort of investor action in the past has usually not been rewarded.
Tom McClellan
Editor, The McClellan Market Report
Jun 06, 2019
High Yield Bonds Back to Bullish Mode |
Dec 01, 2016
McClellan Oscillator for Corporate Bonds |
Mar 28, 2019
Bond CEF A-D Line Showing Big Strength |