Gold’s Message For Crude Oil

Free Chart In Focus email
Delivered to you every week
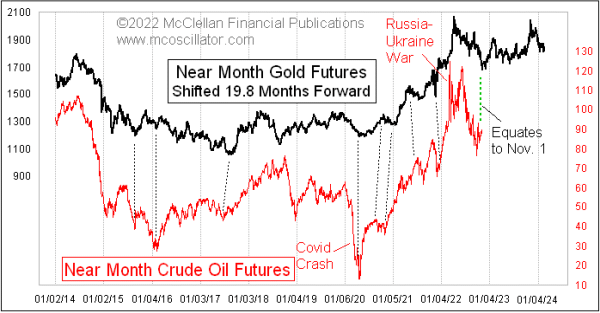
I like getting the answers ahead of time, and one of the fun relationships that does this is shown in this week’s chart. The movements of gold prices tend to get echoed almost 20 months later in corresponding movements of oil prices. This relationship works really well, most of the time, but it admittedly went haywire for a while in February 2022 when Russia invaded Ukraine. We should forgive gold for not knowing that was going to happen.
Since that event, and its delivery of a brief visit to above $120/barrel, oil prices have been working hard to get back on track with gold’s agenda. Oil prices have been falling for most of 2022. Your pump price may be a different story, but in the crude oil futures market there has been a drop.
We are now at the echo point of a bottom in gold prices 20 months ago, which should mean a bottom for oil prices now. The correlation is not working out exactly perfectly, but it is pretty close. Gold’s message now is that oil prices should rally from here into January 2023, then chop sideways for most of the rest of 2023 as a setup for a big surge in October-November 2023.
This chart does not quite show the most recent gold price data, with gold having fallen just recently below 1640. That gold price drop will mean a drop for crude oil prices, but not until we get to the echo point 19.8 months later. I chopped that off from the chart so as to prevent the eye from being distracted from the immediate future by looking too far ahead.
I have no idea why it would be that gold knows ahead of time what oil prices are going to do, nor do I know why 19.8 months is the lag time. That is just the amount of time that works out to give the best fit to the price plots, most of the time anyway.
I chalk up such phenomena to a category of financial market events I call “liquidity waves”. The same wave that passes first through the gold market will eventually pass through the oil and bond markets. It is like standing on the end of a pier, and watching a wave pass under your feet. That same wave will eventually hit the sand on the beach, and so if you know how fast the wave is traveling and the distance to the shore, you can know when it will hit.
We do not have to know why it works the way it does in order to take advantage of it. After a certain amount of time seeing it functioning this way, at some point we can come to accept that it does work, even if we cannot explain the “why” part.
Tom McClellan
Editor, The McClellan Market Report
Jan 14, 2021
Gold Leads Interest Rates |
May 06, 2011
Gold Foretold The Commodities Dip |
Feb 13, 2020
Crude Oil’s Drop Was Foretold by Gold |