Grains Down, Beef Up

Free Chart In Focus email
Delivered to you every week
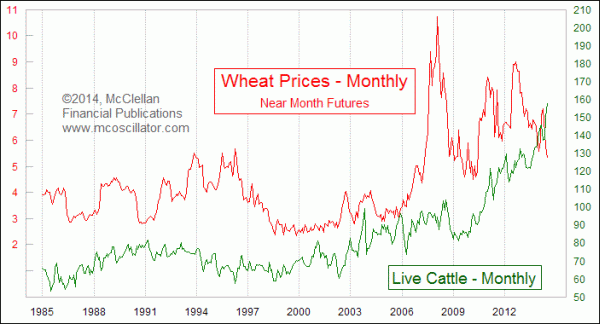
Grain prices have been falling, as expected. But cattle prices have been rising, which might not be as expected. There is a lesson in this difference.
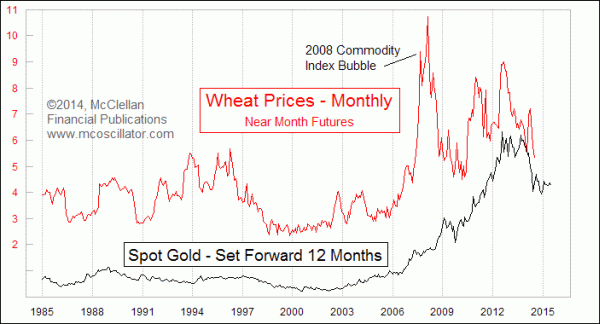
Gold prices give us a year’s warning about what grain prices are likely to do. That is counterintuitive, since grain prices are often dependent upon climatic growing conditions, while gold prices are dependent upon monetary conditions as dictated by the Fed and similar agencies. So how is it that gold could know a year in advance the direction that grain prices will go? THAT is one of the fun and enduring mysteries of the financial markets.
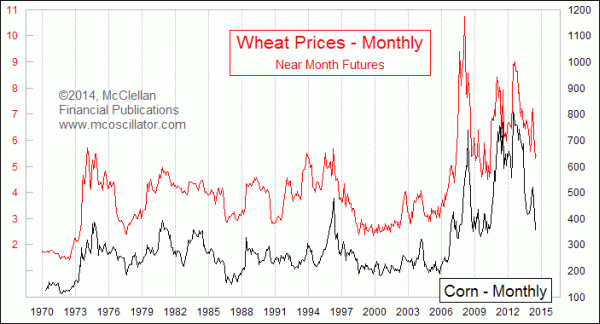
The lead chart shows gold’s leading indication for wheat prices, which have been tracked by historians back several centuries. Corn is a new-world crop, but it correlates well with wheat prices because the growing conditions are similar for both crops, affecting the supply side of the ledger. And both are usable as feed for livestock such as cattle and hogs, so from that standpoint they are somewhat interchangeable. That’s why their prices are so well correlated.

Funny thing: cattle prices are actually not well correlated to grain prices. One might reasonably think that as the inputs to building a cow from scratch increase in price, then cattle prices would rise in sympathy. But the reality is that it does not work that way. Instead, the two move more in opposition.

This makes some sense. If corn (feed) prices rise, cattle ranchers will sell their herds because it is too costly to feed them, and so cattle prices go down because of the extra supply hitting the market. But as herds shrink, the demand for corn (feed) decreases, and so prices of corn go down.
At the same time, a phenomenon that economists call the “hog cycle” is in operation. The basic idea is that livestock farmers watch prices, and respond to them in their decisions to produce or not produce. But there is a lag in terms of the biological response. A farmer can make an economic decision to respond to the prices that the market is offering for what he produces, but it takes a while for his herd to respond and produce what he needs to sell. Other livestock producers are simultaneously making decisions about how to respond to market prices, and so the lead/lag in this biological response produces exaggerated effects on prices. The multiple farmers who all respond to a shortage by trying to produce more suddenly see a glut when their product is collectively ready for market, because they all try to come to market at once.
The good news from all of this analysis is that consumers of meat have something to look forward to. The bottoming of gold prices in December 2013 means that we should see a general bottoming for grain prices a year later in December 2014. And THAT should mean a topping out for meat prices at the same time, due to their inverse relationship. So in 2015 we can look forward to falling prices for cattle, and thus presumably also for hogs, chicken, and other meat products.
EPILOGUE: My father Sherman McClellan got his start tracking the financial markets in the late 1940s, when his grandmother gave him some stock in a new mutual fund that invested in atomic energy related companies. His father and his aunt appointed him to manage the family’s farm in Illinois after their mother died. The land was leased to a tenant farmer, and the terms of the lease were that the owners got half the crop. How much money was earned depended on the prices for corn and oats in effect when they sold their part of the crop. Selling at the time of the harvest in autumn was not the most profitable time to sell and his grandparents never sold then. Prices for corn were depressed then by the excess supply.
Sherman did not understand at first when was the best time to sell, and so he studied the chart history of corn prices in order to gain a better understanding of when it was the best time to sell the crop. It turned out that drying and storing the corn crop until the next spring or summer made a huge difference, because the hog farmers who would buy the corn tended to begin running out of their stored supply in the spring. Prices would rise for last year’s crop prior to the next crop being harvested. Studying corn price charts led to further studies, including an investigation of the stock market, and ultimately into market breadth statistics.
At that time when Sherman was making the decisions about when to sell the farm’s crop (the 1950s and 1960s, prior to the farm being sold to avoid out of state probate), gold prices were still fixed by the U.S. government, and so the leading indication from gold for grain prices was non-existent. Now we are able to get the message a year ahead of time about how future grain prices will move by watching what gold prices did a year before.
Tom McClellan
Editor, The McClellan Market Report
Jul 10, 2014
Inflation Arriving For A Short Stay |
Aug 29, 2013
Gold Says Wheat Prices To Drop |
Mar 16, 2012
In Order To Tame Inflation, Just Tame Uncle Sam |