Higher Drug Related Fatal Crashes After Marijuana Legalization

Free Chart In Focus email
Delivered to you every week
I don’t smoke pot, and I generally don’t like hanging around with people who do. This applies especially to those who are driving in the lane beside me, doing 70 MPH on the Interstate.
At the same time, I don’t really appreciate having the government tell me what I can or cannot put into my body. Tell that other fellow, but don’t tell me.
I live in Washington State, which since the Nov. 2012 election has been undertaking a great social experiment thanks to a popular referendum which legalized recreational (vs. medicinal) marijuana use. This week, I found myself wondering what the effects of that change have been on vehicle accidents.
Thankfully, the Washington Traffic Safety Commission (WTSC) has been compiling such data since 2008, and they are the source for the data in this week’s chart. I have not yet checked for data from Colorado, or other states in the process of legalizing such marijuana use. So that is a problem for analyzing this big social experiment. So is the small number of years since the change in law, which makes for sample size issues. These are admittedly imperfect data (as all data are).
With those caveats placed on the table, let’s take a look at what these limited data do say.
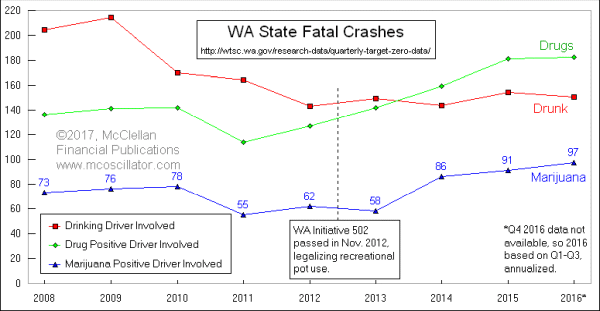
Since 2012, fatal crashes involving drunk (alcohol) drivers have continued to trend gently downward. It is not a fast enough downtrend to suit me, but it is a useful baseline for comparison, especially in comparison to other types of intoxicants.
Also since 2012, fatal crashes involving stoned drivers have been trending upward, breaking a downtrend which preceded the change in the law. The data for “drugs” includes the data for “marijuana”, and the chart makes it pretty clear that the new upward trend since 2012 is the result of higher marijuana-related crashes.
Let me circle back at this point and note that we are still talking about relatively small changes in total numbers. And I should further note that it feels rather morbid to talk dryly about car accidents in which real people died, and to use statistics to point fingers. I get both points about how creepy and how statistically dubious this is, given the limited data.
And I want to further stress that these stats are only for crashes that were fatal. The Washington Traffic Safety Commission does not offer statistics on marijuana involvement in crashes which are less than fatal. That’s a problem with this analysis, and not one I can remedy with the available data. We also cannot adequately rule out other factors, such as changes in population density, changes in law enforcement priorities, effects of changing road conditions, etc.
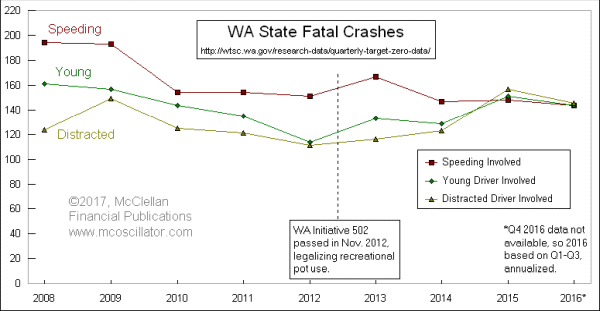
One technique that we can employ with the limited data is to compare the rise in marijuana and overall drug crashes with those due to other causes, or as Claude Rains would have said in Casablanca, “the usual suspects”. So here in this next chart, I present some of the other factors included in that data series from the WTSC:

The fatal crashes associated with speeding and with young drivers have continued to generally trend downward (hurray!!!). The “distracted” crashes have seen an upward movement since the 2012 change in marijuana laws, but that may be reasonably explained by the increased penetration of smart phones into society.
The point of this comparison is to provide a background of other “usual suspects” to compare against the observed change of trend in the “marijuana” and “all drugs” data. If the uptick in those series were part of some background change in circumstances, such as larger numbers of drivers being on the road, or greater general road safety problems, then we should expect to see the uptick in crashes appear across all types of crashes. But when we see a general continuing downtrend in crash statistics except for “distracted” and “drugs”, then it is reasonable to conclude that the change in drug use law has resulted in a change in accident rate outcomes.
Now go forth and draw your own conclusions. But don’t bother to pass me that doobie. And put down your phone when driving, please, especially when you are passing me.
Tom McClellan
Editor, The McClellan Market Report
Oct 22, 2015
Tracking Data on Police Officer Deaths |
Apr 23, 2010
Home Prices and the Birth Rate |
Jul 28, 2016
Some True Stats About Crime Rates |