Some True Stats About Crime Rates
Free Chart In Focus email
Delivered to you every week
This being a campaign season, you are going to hear a lot of assertions about crime rates and the supposed solutions that various sides are proposing. So this seems like a good time to share a few bits of truth about crime data in the US, and what it is correlated to, and not.
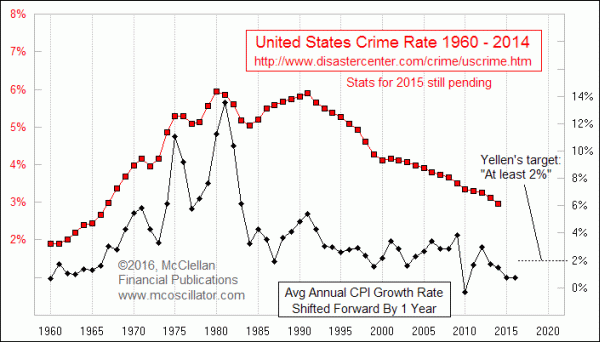
The chart above shows the best correlation I have found to the crime rate. The annual growth rate in the Consumer Price Index (CPI-U) is shifted forward by a year to reveal how its movements tend to show up a year later in the crime rate. The crime rate data shown here are from the The Disaster Center, a web site with a wealth of information gathered from public sources. The crime rate data are here.
The implication of the chart above is that crime rate data follow the inflation rate. If inflation rates should rise, experience says that crime rates should also rise. Saying it another way, the falling crime rates since the peak in 1980 are reliably associated with the falling inflation rate since then. This data does not cover all of the history of crime in the U.S., only the period of reliable statistics on crime gathered and reported by the FBI. But it is 55 years’ worth of data, and so at some point we should start to accept that the correlation is valid.
All of this is relevant to those who follow the financial markets because of one factor: The Fed wants to raise the inflation rate to 2%. The past 4 years have seen CPI inflation rates below 2%, which bothers the experts at the Fed who know what is best for us, and they think it would be better if inflation was higher. But they don’t understand that this also means crime rates should be higher a year later, assuming they were ever even successful at bringing about that desired higher inflation rate.
One of the big (but unsupported) beliefs among crime “experts” is that an economic slowdown will bring a rise in crime rates. While that idea can be supported if one looks at only a small segment of the data, say 10 years or so and carefully selected, it falls apart when seeing the whole history:
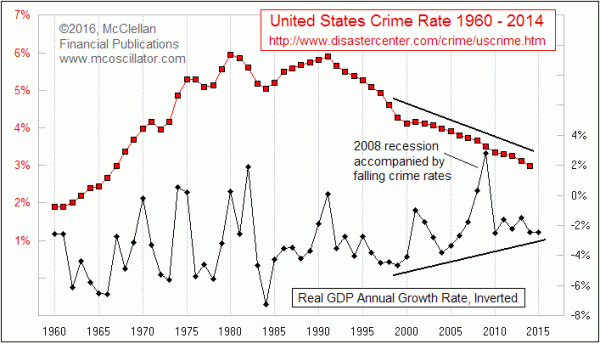
In this chart, I am displaying the GDP growth rate on an inverted scale, in hopes of better correlating the supposed rise in crime that should happen with an economic slowdown. This shows us that things have not worked out like the “experts” say they should, which must be endlessly frustrating for them. If only they would look at the right data.
One point to understand is that the overall crime rate does correlate well with subsets like robbery rates, violent crime rates, etc. Here is what I mean:
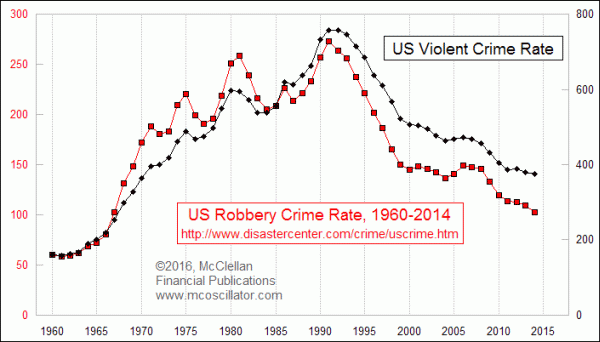
Interestingly, the overall crime rate peaked in 1980, but both robbery and violent crime rates peaked in 1990. That later peak did echo a rise in the inflation rate, although the magnitudes were different.
Some advocates will point to the high incarceration rates in the U.S. as the reason for the falling crime rate. While that makes intuitive sense, i.e. fewer bad guys out in public doing bad things, it does not explain the trends in the data.
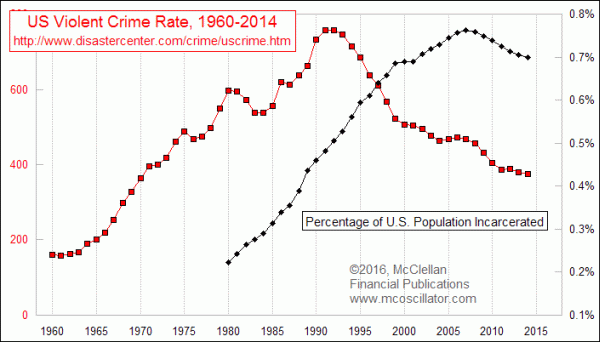
The incarceration rate data are from the Bureau of Justice Statistics. The crime rate peaked in 1980, but the rate of incarceration peaked in 2007. Both have been falling since then. So while it is assuredly a good idea to lock up bad people and thus keep them from committing more crimes, the incarceration rate is not an explainer of all of the trends we see in the crime rate data.
The most fanciful hypothesis about crime that I have heard is that global warming is supposedly going to increase the crime rate. This next chart shows that this hypothesis works during about a quarter of the years for which there are good crime rate data. The rest of the time it is a horrible correlation, or more precisely stated, it is the definition of a non-correlation.
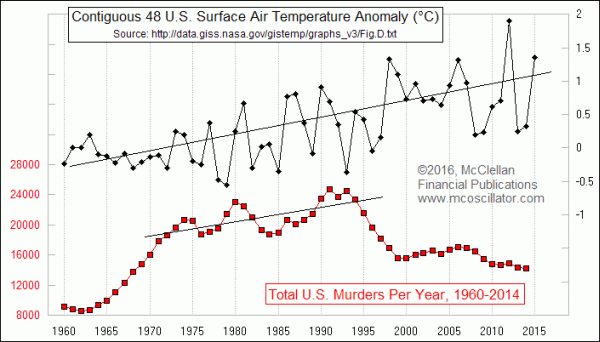
The published temperature indices have continued to rise even as crime rates have trended lower, including the murder rate in the U.S. So no, the higher temperatures are not bringing about a rise in the collective madness of Americans, nor driving us into a life of statistically-detectable crime, at least not yet.
The point of all this is that whenever you hear simplistic explanations about what drives crime rates and what will fix that problem, you should be suspicious, and ask the asserter to show you the data as I have done. And you should heap scorn and derision on the Fed and its economists for wanting to raise the inflation rate, and thus the crime rate.
Tom McClellan
Editor, The McClellan Market Report
Oct 22, 2015
Tracking Data on Police Officer Deaths |
Dec 18, 2009
Drop in inflation should bring DROP in crime |
Jul 30, 2015
Debunking the Fed as the Controller of Inflation |