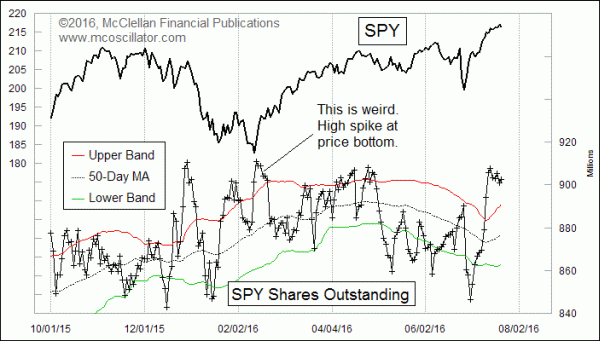
SPY Shares Outstanding Showing Topping Condition

Free Chart In Focus email
Delivered to you every week
I like to watch the data on the number of shares outstanding in certain select ETFs, and one of the best for this purpose is the biggest one, SPY. It tracks the SP500, and it currently has $196 billion invested in it. So it is a big deal.
The number of shares outstanding fluctuates with investor interest in the stock market. As more people start buying shares, the share price can start moving ahead of the net asset value (NAV), and so the sponsoring firm issues more shares, thereby keeping the share price and NAV as close as possible. Likewise, when investors start selling, shares get redeemed. And in the process, we can get insights about investor sentiment when this data on shares outstanding gets to an extreme value.
But what is extreme? The numbers can trend higher and lower over time so I have found that using 50-1 Bollinger Bands is helpful. That notation means that I use a 50-day moving average and 50-day standard deviation, and then the upper and lower bands are each set 1 standard deviation away from that moving average.
The current reading is way up above the upper band. In fact, it is 3 standard deviations above that moving average right now. It is reminiscent of the sudden surge we saw back in December 2015, just before the sharp drop in early January 2016. This big rush into SPY says investors have suddenly become exceedingly interested in being invested in SPY lately, and whenever the crowd rushes in like this, it is a sign of excessive bullish sentiment.
If you want to track these data yourself, Interactive Data Corp. (parent company of eSignal and QCharts) has it under the symbol $SPY.SO. Yahoo! Finance also has it as SPY-SO although they do not seem to be able to chart it. SPY's sponsoring firm makes it available on its web site, although not in historical form. Other services may have it as well; check with your data provider.
Tom McClellan
Editor, The McClellan Market Report
Apr 07, 2016
Eurodollar COT Throws a Curveball |
Feb 11, 2016
We Americans Are a Pessimistic Lot |
Feb 18, 2016
VXX Shares Outstanding Data Work Differently |