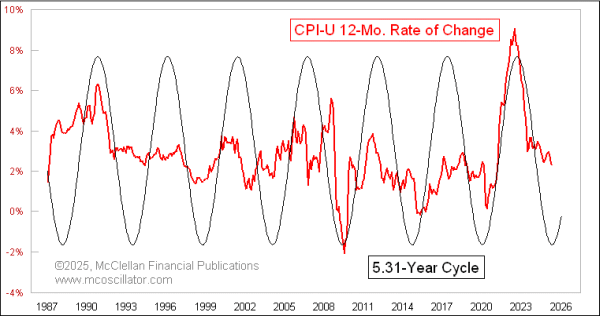
Inflation’s 5.31-Year Cycle Is Bottoming
Free Chart In Focus email
Delivered to you every week
The FOMC in June elected not to cut its interest rate target, even though inflation data are coming in lower than feared. Their claim is that they don't know what the inflationary effects of tariffs are going to be. We already have the lowest annual CPI inflation rate since Covid. That’s the good news, but whether it is good enough to convince the Fed to cut at the July 29-30 meeting is a different question.
The FOMC members are likely unaware that there is a 5.31-year cycle operating in the inflation data, as shown in this week's chart. And this has been functioning for several years, so it is likely an enduring feature. 2025 is when this cycle is supposed to be bottoming, and so then we can expect an upward bias to the inflation data during 2026-27. Given the long history of how this cycle works, it would be quite exceptional if the Fed and the White House could together manage to exempt themselves now from its forces.
This cycle's effects are not a recent phenomenon. This next chart shows this same cycle, extended back further in time.
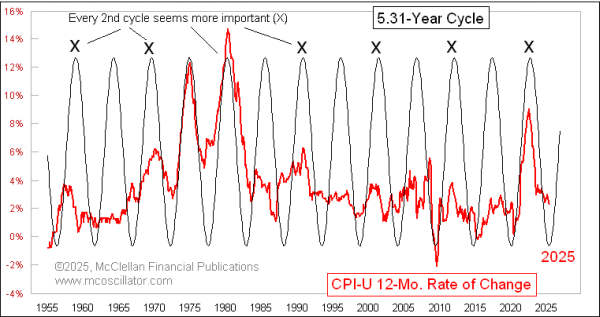
This longer term look allows us to see one additional feature, which is that every other cycle peak tends to bring a stronger effect in the inflation data, as marked by the Xs. The latest of these brought us a peak rate of 9.1%, thanks in part to the way that Congress and the Fed responded to Covid. But Covid was just an amplifying factor, not a causative factor according to this cycle’s long track record.
You might be wondering why this cycle has such a regular period of 5.31 years. And as you wonder about that, your mind might wander to the point of realizing that this period is exactly half of the 10.6 year sunspot cycle. I believe that this is not a coincidence, although I do not have a scientific explanation for how sunspots can perform this magic trick. After seeing that it does work over several decades, I am okay letting go of the quest for the “why”, and content to see the “is”.
The bottom chart compares the CPI inflation rate to the monthly sunspot number. One key adjustment is that I have shifted forward the sunspot data by 12 months, to get a better fit. I would invite you to notice that after this 1-year adjustment, there is nice alignment of both the sunspot peaks and sunspot minima with bottoms in the CPI inflation rate. The peak (thus far) for the current sunspot cycle was in August 2024, so if the 12-month offset worked perfectly that would mean an inflation low due in August 2025. It does not work perfectly, though. It merely works amazingly, not perfectly.
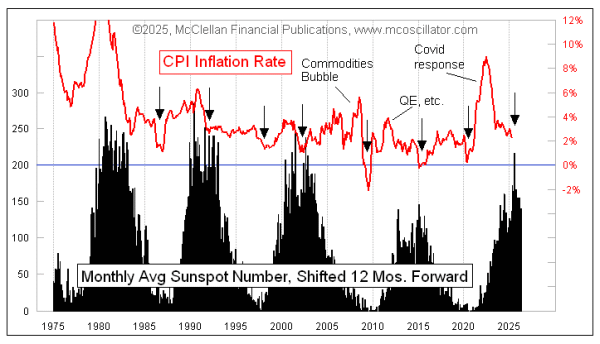
The arrows in the chart highlight the inflation rate bottoms which coincide with the sunspot peaks and troughs. I would not want to have to pick the exact month, but it is fair to say that 2025 is when the next minimum is due for the CPI inflation rate. So if the Fed cuts this year, as they arguably should feel allowed to do because of the lower inflation rates, we are likely to see those cuts get taken back in just a few months as this cycle does its magic on inflation. The important point for investors is that rising inflation is generally not a good thing for interest rates, something which gold already told us to expect.
Tom McClellan
Editor, The McClellan Market Report
Aug 17, 2022
5.31-Year Cycle In CPI Inflation Rate |
Sep 12, 2024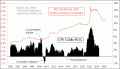
M2/GDP Tells Us About Inflation |
Dec 17, 2021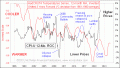
The Planet Has Something to Say About Inflation Being “Transitory” |