Lumber Sees Rogue Wave, Now Ready For a Bounce

Free Chart In Focus email
Delivered to you every week
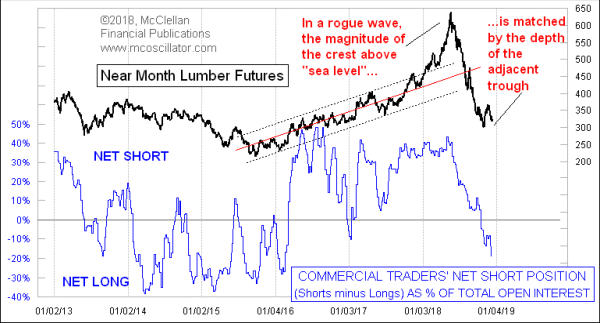
Lumber prices are going through what I call a “rogue wave” event, named for the massive oceanic waves which can swamp ships. The physics of the oceanic rogue waves are similar to those in the financial markets. The implication for lumber futures prices is that we should see a return to the 450-500 area, up from the current prices in the low 300s.
In the ocean, a rogue wave forms when one wave “borrows” energy from adjacent waves, making a localized wave crest well above the surrounding sea level. Rogue waves in the ocean are also marked by having an adjacent trough that is just as far below the normal sea level as the crest is above it. It is that combination of a high crest and a deep trough which makes these waves so destructive.
I first started noticing rogue waves in the financial markets after reading an article about oceanic rogue waves in the Dec. 2010 issue of National Geographic. It featured the graphic below, a time plot of an actual rogue wave recorded at an offshore oil platform. I immediately recognized the pattern as being that of the DJIA around the time of the 1929 peak and the ensuing bear market to the 1932 low. So I put those two images together to prove that what my eyes were seeing was in fact correct. The pattern is the same, including the minor waves leading into and out of the big event, as long as we take a broad view of what “sea level” means in the stock market. I featured this comparison previously in the Feb. 15, 2018 Chart In Focus article, Stock Market In a Rogue Wave.
.gif)
The key similarities in financial rogue waves are that the peak and the trough are both about the same distance above and below some median line which existed before the rogue wave formed, and to which prices return after the trough. So applying that principle to the plot of lumber futures prices, we can notice that the median line of the price action which preceded the rogue wave is now at around the 450 price level. To complete the rogue wave pattern, prices ought to return to that level over time.
Also featured in this week’s chart is a look at what the COT Report data say about lumber futures. The commercial (big money) traders of lumber futures had been at a big net short position as a group when lumber prices topped at 639 in May 2018, correctly betting on the big price drop that we have seen. Now they have moved to the biggest net long position since early 2016, and that move to the long side is happening quite rapidly. It is as if they are in a big hurry to get themselves repositioned for what they see coming, the big price rebound that would complete the rogue wave structure.
Tom McClellan
Editor, The McClellan Market Report
Dec 10, 2010
After The Rogue Wave |
Feb 15, 2018
Stock Market In a Rogue Wave |
Mar 08, 2018
A Follow-Up On 3 Charts |