McClellan Oscillator for Investment Grade Bonds

Free Chart In Focus email
Delivered to you every week
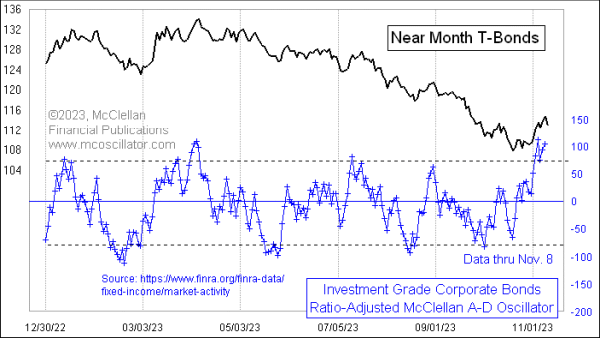
T-Bond prices fell on Nov. 9, 2023, on news of an auction of $24 billion in new 30-year T-Bonds that did not go very well. The setup for this drop was already there, based on the recent run up in bond prices, which has also affected the corporate bond market.
FINRA publishes data for each trading day on how many corporate bonds went up or down (Advances and Declines). They separate out the data into Investment Grade, High Yield, and Convertible Securities. This week's chart above shows a Ratio-Adjusted McClellan Oscillator (RAMO) for the A-D data on the Investment Grade category. These bonds tend to behave a lot like T-Bond prices, whereas the High Yield (AKA junk) bonds tend to move more like the stock market.
The recent rally in T-Bond prices has pulled Investment Grade bonds up in sympathy, resulting in a lot of days with many more Advances than Declines. And that condition has brought about an overbought reading for this RAMO.
When the NYSE's McClellan A-D Oscillator gets up to an overbought level, that can sometimes be a signal of strong initiation of a new uptrend, and a promise of more buying to come. But it does not seem to work that way for this McClellan Oscillator for corporate bonds. Here, the message of a high reading is more uniformly one of an overbought condition that needs to be addressed by a pause or a pullback.
Here is where I traditionally remind readers that overbought is a "condition", and not a "signal". An overbought or oversold condition does not have to matter right away just because we notice it. But they do tend to matter eventually. The implication now is that corporate bonds and T-Bonds should pull back in price.
PRIOR ARTICLES:
Corporate Bonds Show Oversold Condition For T-Bonds, June 17, 2022
McClellan Oscillator for Corporate Bonds, Dec 1, 2016
McClellan Oscillator for High Yield Bond A-D Data, Sep 14, 2016
Tom McClellan
Editor, The McClellan Market Report
Jun 17, 2022
Corporate Bonds Show Oversold Condition For T-Bonds |
Dec 01, 2016
McClellan Oscillator for Corporate Bonds |
Sep 14, 2016
McClellan Oscillator for High Yield Bond A-D Data |