New York Weather Is Bearish

Free Chart In Focus email
Delivered to you every week
The recent news reports about the unusual weather on the east coast of the U.S. have mostly been about how unseasonably warm it has been for December. The story that they are missing is about how the lack of rain in New York City is bearish for the stock market.
I have written about this relationship before. And I am not saying that droughts in New York City cause bear markets, or vice versa. I am just noticing that for many decades the two phenomena have been associated with each other. It might be nice to know the root cause of this relationship’s existence, but we don’t need to know the “why” in order to see the correlation.
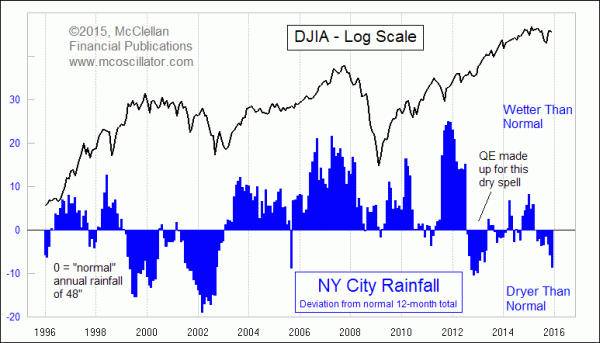
The past 12 months in New York City’s Central Park weather station have seen rainfall that was 8 inches below the normal 48” annual total. The recent peak in annual rainfall came for the 12 months ending in January 2015, just one month ahead of the DJIA’s February 2015 monthly closing high. The drying trend since then has coincided with the poorer conditions for market liquidity.
Back in 2013, there was a dry period in New York City which did not see a matching decline for stock prices. But remember that the Fed was in the throes of pumping $85 billion per month into the banking system then, which had an understandably bullish effect on stock prices. We do not have that now, at least not in the USA.
There was also a bit of an anomaly back in 1999, when a drought in NYC did not stop the DJIA from continuing to rise. In response, I would point out that the Advance-Decline Line peaked back in April 1998, and the majority of stocks were moving lower in 1999, and not participating in the Internet Bubble.
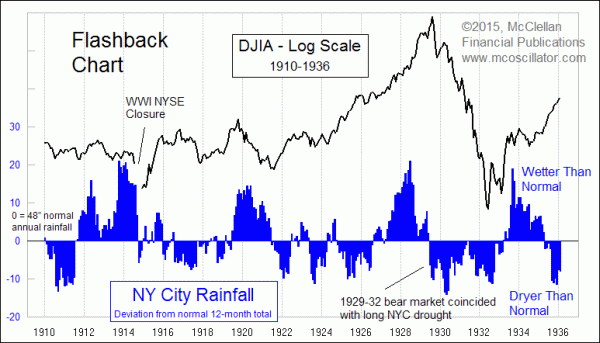
As I noted in my May 2011 Chart In Focus article on this topic, this is not a new phenomenon. Here is a look back at another period, just for example:

The post-WWI boom and bust for the stock market matched a similar rise and fall in NYC rainfall. The boom in the late 1920s came with an extremely high amount of rainfall in NYC, and then when the rain stopped coming as much, the stock market started to decline. In 1933, the rain and the bull market returned.
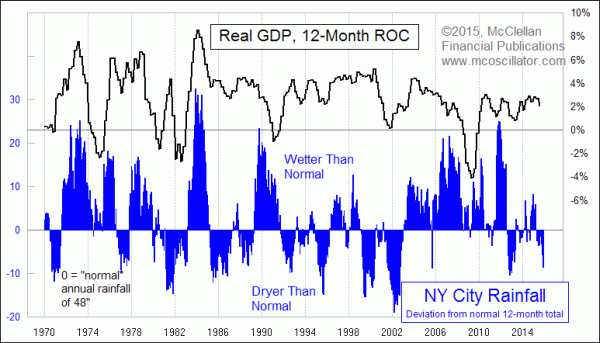
If after seeing these correlations over long periods, one is still not satisfied and wants to get at the root cause of this relationship, then consider this next chart:

There is a pretty decent correlation between NYC rainfall totals and GDP growth rates. The correlation is even stronger at the extremes for rainfall. Since the stock market and GDP growth have a well-established and accepted relationship, perhaps seeing the rainfall correlation to GDP can help a person accept the stock market behavior relative to rainfall.
So if you are bullish on the stock market and the economy, you should pray for rain to come to New York City.
Tom McClellan
Editor, The McClellan Market Report
May 20, 2011
NY Investors Should Learn To Like The Rain |
Sep 24, 2015
Bund Spread Gives Permission for Bear Market |
Aug 21, 2015
Eurodollar COT Says Ugly Drop Is Still Ahead of Us |
Jul 30, 2015
Debunking the Fed as the Controller of Inflation |