Reverse Repos Waning

Free Chart In Focus email
Delivered to you every week
Fear not the end of Reverse Repos. The Fed can always go back to doing outright repurchase agreements.
A lot of analysts have noted that the size of the Fed's book in Reverse Repurchase Agreements (RRPs) has gotten really small lately. The NY Fed reports its level daily via the St. Louis Fed's great FRED web site, at https://fred.stlouisfed.org/data/RRPONTSYD. Those data are what I show in the chart above, with a couple of adjustments. The first is that I invert the scaling, so the shrinkage of RRPs shows up as an uptrend to better match the stock market. The second adjustment is that I have shifted forward the plot of RRPs by 5 trading days to show how their movements get echoed in stock prices a week later.
To understand the repo market, I suggest that you read What Is A Repurchase Agreement? from the folks at Investopedia. The short version is that a repo is a loan to a bank or hedge fund. So if the Fed (or anyone) makes more of those loans, then the hedge fund honchos have more money to pour into the stock market. If you reduce such lending to hedge funds, then they have to find other sources to borrow from or close out positions to pay back the loan, and stock prices tend to fall.
A Reverse Repo does it the other way, wherein a bank "buys" Treasuries from the Fed to make its balance sheet look better, but pledges its loan portfolio as collateral. The Fed agrees to buy back those same Treasuries at a later date. Doing more RRPs means more capital gets tied up, and is not available to do things like lift stock prices. Unwinding those RRPs means more capital is available, and it works its way into the stock market with about a 1-week lag. I have highlighted in that chart above that activity picks up in RRPs at the end of every calendar quarter, as part of banks doing "window dressing". Those end of quarter spikes do not seem to get echoed in stock prices, but other movements do.
The worry is that the Fed's holdings of RRPs are getting pretty low, so at some point there will not be any more of them to unwind, and thus the stock market will lose that boost factor. But if that happens, the Fed can just go back to doing regular repos if they want to manipulate the banking system (and the stock market), with the caveat that even ordinary repos have to get unwound eventually, which is painful for the stock market.
Here is a great historical example, which first appeared in a Chart In Focus article on Feb. 28, 2020:
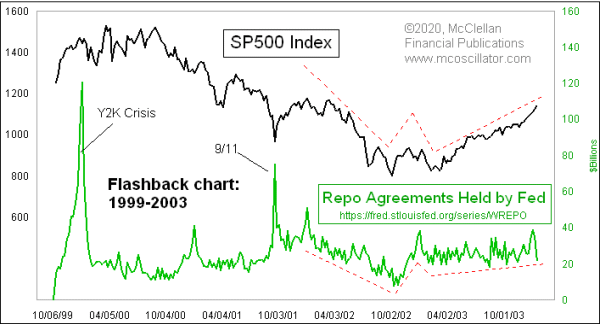
The Fed was quite active with repos in the 2000s. As the size of the repo book waxed and waned, stock prices responded in kind. The Y2K crisis and the 9/11 attacks brought temporary shocks to the financial system, which the Fed met by throwing money at them through the repo system (and in other ways).
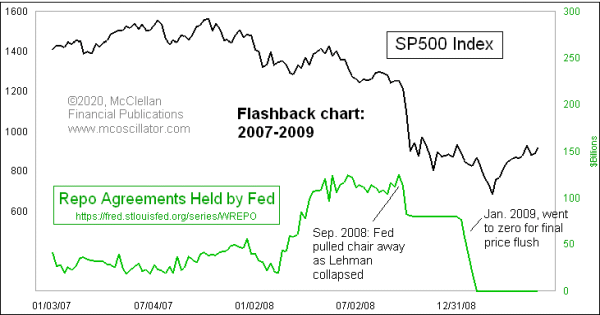
The Fed's manipulation of the banking system via repos became a big problem in 2008 when they inexplicably decided that it was time to cease doing them, triggering the financial crisis in the process.
They eventually came up with doing "quantitative easing" or QE starting in 2009 as their new way to push money into the system. But repos are still a thing, and the Fed still turns to them from time to time.
2020 was a great example of the Fed doing that, and of it turning out badly.
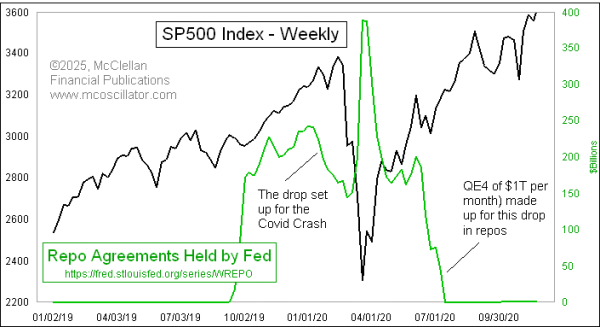
A big boost in repos starting in September 2019 brought a great rally in stock prices, which arguably got them over-extended. Then Covid hit, stocks crashed, and the Fed had to act quickly. They did that first with another big spike in repos, and then very shortly after that with the start of QE4, which injected $1 trillion per month into the banking system and made repos irrelevant. But the fingerprints of the Fed's fluctuations in the size of their repos still show up in the pattern of the SP500 movements.
Post-Covid, the Fed has been very quiet in its repos activity, except for a brief spike in the spring of 2023 when SVB (Silicon Valley Bank) blew up. The numbers of repos are not zero, but they are tiny now. That could all change if and when the Fed decides to put a thumb on the scale again in the future.
So we don't have to worry much about the eventual loss of reverse repos, if that total ever gets down to zero, other than for the sake of losing a great 1-week leading indication (which I feature frequently in my Daily Edition).
Tom McClellan
Editor, The McClellan Market Report
Feb 28, 2020
Fed Pulling Back from Repos at The Wrong Time |
Oct 25, 2024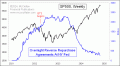
Reverse Repos Mitigate Fed’s QT |
Jun 10, 2021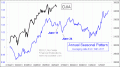
Seasonality Versus The Fed |