Revisiting Reverse Repos

Free Chart In Focus email
Delivered to you every week
When the Fed first started doing "Quantitative Easing (QE)" in 2009, it was a new concept. Nobody had ever seen the Fed do that before, so it was hard to know what the outcome was going to be. We now have seen 4 different rounds of QE, and the conclusion is pretty obvious that doing QE boosts liquidity in the banking system, and it boosts the stock market.
Similarly, doing the opposite known as "Quantitative Tightening (QT)" takes away liquidity and hurts the stock market when the Fed has done it too aggressively. But there are other ways that the Fed's interventions in the banking system can affect liquidity.
One of the wonkiest of these is via Reverse Repurchase (RRP) Agreements. Stay awake for a moment, please, as I explain why this is important. A regular "Overnight Repurchase Agreement" involves a transaction between the Fed and a member bank, where the Fed buys assets (usually Treasuries) from the bank and gives the bank cash equivalents. That boosts the bank's immediate liquidity, and it has helped the stock market in past years when the Fed used to do it more frequently. The transaction involves an agreement for the Fed to sell the same assets back to the bank sometime later.
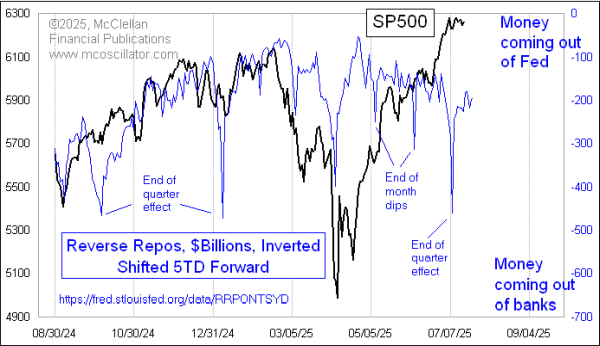
The opposite transaction is a "Reverse Repurchase Agreement", which involves the Fed selling Treasuries to a bank in exchange for some of the bank's lesser quality holdings. This is done usually to make a bank's balance sheet look better, with more Treasuries and less stinky stuff on it. We see it happen in a big way at the end of every calendar quarter for window dressing, and now recently at the end of each month too. A RRP ties up banking liquidity, keeping it from doing other useful things like helping to lift stock prices. So not surprisingly there is a correlation between the total amount of RRPs the Fed is engaged in and the movements of stock prices.
That is what this week's chart shows, although I have made a couple of adjustments. The first is that I have inverted the scaling of the RRPs data, and then the second is I have shifted it forward by 5 trading days to show how there is a lag time between changes in RRPs and the echo in stock prices.
A few months ago, some analysts were worried about what would happen to the stock market uptrend when RRPs got to zero, and could not go any further. That premise is a bit flawed, because the Fed could always just do regular overnight repurchase agreements, and inject liquidity that way. And what we have seen is that RRPs bottomed out (topped in this chart’s inverse scaling) and have been trending to larger numbers since then.
It is normal to see big spikes for window dressing at the end of each month and quarter. But then the RRP data usually
get back quickly to where they were before. That is not happening (yet) this time, which says that there is trouble brewing.
Because the close nature of the relationship between the SP500 and RRPs (inverted) may be a little bit hard to see in the chart above, I have replicated it in a different way, doing what I try almost never to do, and having the data from the two plots mix together in the same space on this next chart.
Doing this scaling adjustment allows us to better see the tight correlation between what RRPs did and how the SP500 reacts (5 days later). The large magnitudes of the end of month and end of quarter spikes may not show up so much as big moves in the SP500, but the dance steps are still there.
We just had the standard end of quarter spike at the end of June, and there was a minor dip a week later in the SP500 to honor that. But what is troubling is that the RRPs are not diminishing (going higher on the inverted scale) in the days after that end of June spike. Banks are continuing to hold onto the Fed's Treasuries, and that should be having an effect on financial market liquidity. The SP500 is not yet reflecting that change in the liquidity pool, but I sense that such a change is brewing. The two plots have gotten too far apart now, and so something is going to have to give.
Banks and the Fed are the best sources of solid liquidity, but sometimes liquidity can arise temporarily just out of bullish investor sentiment. The bombing of Iran's nuclear facilities arguably changed investor sentiment in a big way, and that optimism has helped to push up stock prices to a new price high without the backing of banking system liquidity due to the action in RRPs. Sentiment-based liquidity can very easily go away, though, which is the big risk for the market now, especially if the RRPs data stay like they are.
Tom McClellan
Editor, The McClellan Market Report
Feb 06, 2025
Reverse Repos Waning |
Oct 25, 2024
Reverse Repos Mitigate Fed’s QT |
Feb 28, 2020
Fed Pulling Back from Repos at The Wrong Time |