Simple Vs. Complex Oscillator Structures
Free Chart In Focus email
Delivered to you every week
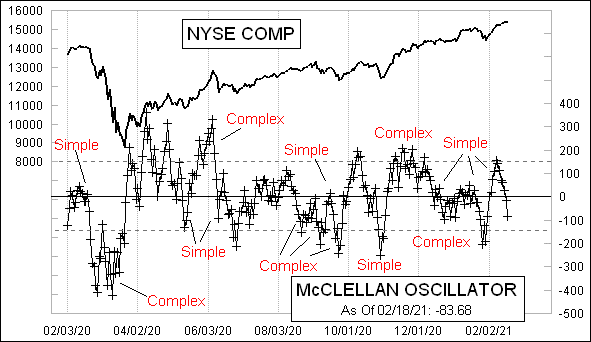
A year ago, I wrote here about how the nature of structures in the McClellan A-D Oscillator carries important information about what lies ahead. A “complex” structure is one that features chopping up and down without a crossing of the zero line. Such a complex structure implies strength for the side of zero on which it forms, either bullish strength or bearish strength.
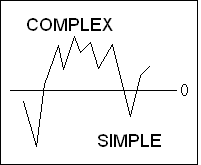 A “simple” structure, by contrast, involves no chopping up and down on one side of zero, just a move across the zero line and then back again. A simple structure says that side is not in charge.
We typically think of the market as a constant battle between the bullish and bearish sides, and one side or the other can prevail at various times. But there is not a requirement for either side to be in charge. Sometimes neither side is in charge, and that will show up as simple Oscillator structures alternating on both sides of the zero line.
On Feb. 8, 2021, the McClellan A-D Oscillator rose up all the way to +156, a nice high reading that simultaneously shows an overbought condition, and ability to create a strong surge. The disappointment for the bulls is that the Oscillator’s structure on this move has turned out to be just a simple one, with no complexity, and so the message is that the bulls are really not in charge. If we could have seen the Oscillator build a complex structure to go with that nice high reading, then the message would be that we were seeing strong initiation of a strong new up leg. Instead, the message is that the bulls are giving up control, and so the opportunity is there for the bears to attempt to take control. Whether the bears can actually do that is something which remains to be seen.
This principle of complex versus simple structures is not only applicable to the McClellan Oscillator. It also works elsewhere, and here is a great example:
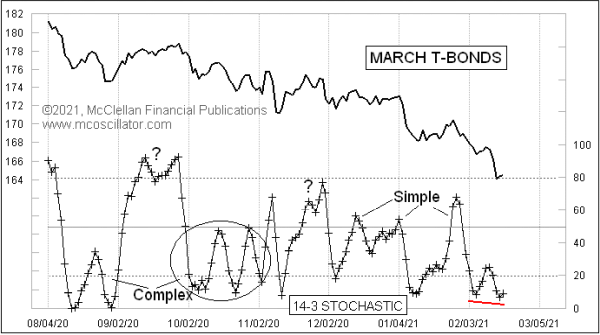
This is a 14-day stochastic oscillator, smoothed with a 3-day simple moving average. For a stochastic oscillator, the 50 level is the “neutral” level, so it is the equivalent of the zero line for the McClellan A-D Oscillator. The same principle of examining complex versus simple structures works for this indicator, and perhaps others.
The current structure for this stochastic oscillator is a complex one, meaning that the bears should be considered to be in charge. And that message should be expected to persist until there is a divergence between this indicator and prices. We do not have such a divergence yet, and instead this stochastic oscillator has made a lower low. That conveys the message that the bears are in charge in the T-Bond market, and more price decline should be ahead. The bulls may mount a counterattack, but they are not likely to take charge again until there is a bullish divergence in this indicator.
There may be other indicators which can be used in this same manner, evaluating the complex or simple structures to get useful information. I have not done an exhaustive study of all possible technical indicators to establish or refute that. If this topic interests you, I would encourage you to be open to applying it to your favorite oscillator or other indicator, and see if it works there. Don’t assume that it will, but do investigate whether it can.
Tom McClellan
Editor, The McClellan Market Report
Feb 06, 2020
Choppy or Simple Structures in McClellan Oscillator |
Aug 01, 2019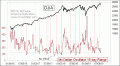
Quiet McClellan Oscillator is a Tell For a Top |
Oct 05, 2017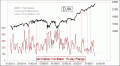
Another Narrow Range for McClellan Oscillator |