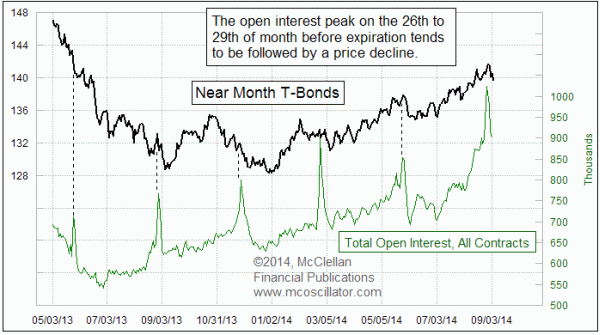
T-Bond Open Interest At a Peak

Free Chart In Focus email
Delivered to you every week
One interesting piece of analysis we have featured recently in both our Daily Edition and our twice monthly McClellan Market Report newsletter involves total open interest in T-Bond futures. There are four contract expirations per year, in March, June, September, and December, and total open interest tends to see a peak late in the month preceding each quarterly expiration.
Specifically, the peak in open interest tends to fall between the 26th and 29th days of the month preceding expiration. This has to do with the nature of the "roll" from one expiring contract to the next one. Unlike other financial futures contracts, T-Bond futures contracts can be created or closed at any time, and so it is possible for open interest to decrease before the specified contract expiration date.
It is an interesting market curiosity that the roll from one contract to the next produces a big spike in open interest in the month before each quarterly expiration. But it is even more interesting to notice how prices behave in the days surrounding this peak in open interest.
For the days leading up to the open interest peak, there is not a reliable statement I can make about how prices behave. But over the several days following the open interest peak, we can see that there is a consistent tendency for T-Bond prices to decline. Sometimes this decline is the result of a price reversal at the moment of the open interest peak. Other times, it is a case of a decline that is already in effect being continued. Either way, the tendency is to see a price decline for several days following the open interest peak.
You may also notice that the most recent peak in open interest is a lot higher than prior quarters. In fact, it is the highest quarterly peak since early 2008. I have tried to postulate a useful hypothesis about what meaning might be found in the absolute magnitude of the quarterly open interest peak. Thus far, I am unsuccessful at finding such meaning.
But for about a week or a little bit more every quarter, open interest tells us when there is going to be a price decline for T-Bonds. That's not everything, but it is good enough to be worth paying attention to.
Tom McClellan
Editor, The McClellan Market Report
Aug 10, 2012
Open Interest Gives A “Tell” For T-Bonds |
Aug 27, 2010
60-year Cycle In Interest Rates |
May 31, 2013
M2’s Slow Growth Creates Opportunity in Bonds |