The Gold/Wheat Ratio

Free Chart In Focus email
Delivered to you every week
You could have bought a bushel of wheat in 2004 for around $3. Now, you'll have to pay more than $7. Who says that there is no food inflation?
Unlike computers, cars, housing, and a lot of the other goods and services that the BLS uses in the Consumer Price Index, there have not been any "hedonic" improvements in wheat. Hedonic adjustments to the CPI calculation take into account factors such as technological improvements that make products more valuable. Your computer today is faster and more capable than your PC 10 years ago. Your car has airbags, and better pollution controls.
Wheat does not have those sorts of improvements, at least not for the consumer. The wheat grown today may be somewhat more disease resistant than in years past, and farmers may be able to get a higher yield per acre, but for the consumer a bushel of wheat still offers just about the same number of calories, vitamins, and other benefits now that it did 200 years ago. So the price of wheat is perhaps a good measure to use in gauging price inflation without those pesky hedonic adjustments.
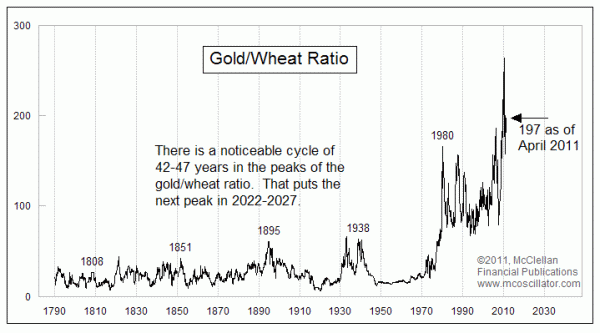
This week's chart takes a look at the ratio of gold prices to wheat prices, in order to see whether the rise in gold prices has taken it too far ahead of the inflation in other commodities. The ratio saw its all-time high in May 2010 at 263. The arrow highlights the current level for this ratio, which is 197. Due to the math involved, this chart reflects not only the ratio of the dollar prices of each commodity, but also how many bushels of wheat you could get for your ounce of gold. A high number means that gold is really valuable in comparison to this one component of our food basket.
Both gold and wheat have become somewhat easier to generate over the last 2 centuries, with innovations in mining and smelting taking place alongside innovations in planting, fertilizing, and harvesting of grains. Men don't kneel by a creek much any more to pan for gold, and neither do they harvest wheat with a scythe. But those improvements in the technology for each commodity have not taken place at the same rate, which likely explains some of the secular growth in this ratio.
There is an interesting cycle evident in the tops for this ratio, with important highs appearing about 42-47 years apart. Tops appear at other times too, but without the same regular periodicity of around 45 years. That same approximate cycle length also shows up in the stock market, economic wars, gold rushes, and other social phenomena. The next peak is therefore due sometime in the 2020s, at which time it would be the smart decision for investors to rotate out of overvalued gold and into food (or into the capacity to grow food).
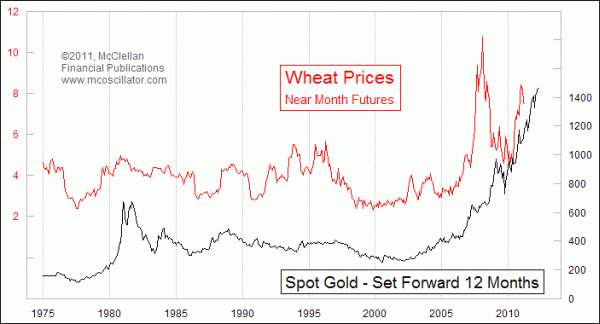
One problem with looking at the gold/wheat ratio in this way is that it examines the price of each of them contemporaneously. That may not be the right way to look at this relationship, since we know that gold prices tend to lead the price changes in other commodities. So this next chart looks at the raw prices for gold and wheat, with the gold price plot shifted forward by 12 months.

I have shown in past articles how gold prices act as a leading indicator for a lot of things, such as CPI inflation, crude oil prices, and the CRB Index, so it is not surprising to see wheat prices follow gold's lead in this way. The implication of the higher gold prices we are continuing to see right now is that we should expect wheat and other food prices to continue rising. We can only expect to see a peak in food prices about a year after we see a peak in gold prices.
Tom McClellan
Editor, The McClellan Market Report
Apr 08, 2011
Bernanke Should Listen To Gold |
Oct 14, 2010
Gold Prices Lead The Way For Commodities |
Nov 19, 2010
Is Gold Overvalued? |
Jan 08, 2010
The One Real Fundamental Factor Driving Gold Prices |