Is Gold Overvalued?

Free Chart In Focus email
Delivered to you every week
The Fed is printing money, and so gold prices are rising. It's a simple matter of dollars per ounce, is it not? If more dollars are printed, but the amount of gold on the planet stays the same, then the price in dollars per ounce should increase, right?
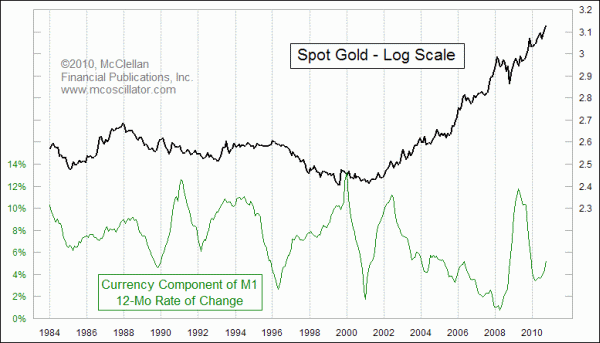
It turns out that this relationship is not so simple. This week's chart looks at the price of gold compared to the annual growth rate in the currency component of M1. This is how much real "money" there is, unadjusted for the multiplying effects of depositing into banks, where it can be loaned out and recounted multiple times. This is the simplest measure of how much "money" there is, and it is also the measure that goes back farther in history than other monetary aggregates (M2, MZM, etc.).
If printing money faster were really what drove gold prices, then we would expect to see a really good correlation between a high growth rate of the quantity of currency and the price of gold. And sometimes we do see that correlation, but then at other times it is like they are moving backwards. So what is going on?
Part of it is what I alluded to earlier, the multiplier effects of the banking system. How much money you think you have is not just dependent on the paper and coin in your wallet. You think of your checking account balance as your money; you might also have a money market account. How quickly people spend money speeds up the circulation, and adds to some of the monetary aggregates to make it seem as if there is more money.
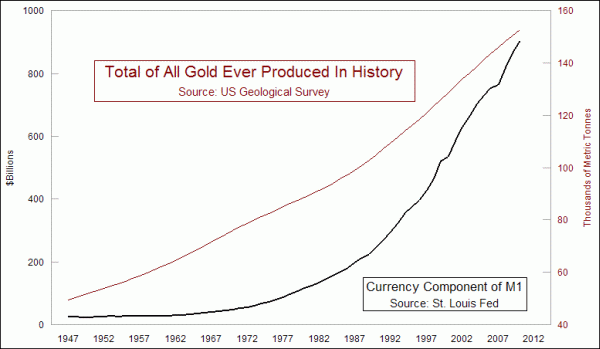
But if we stick to the concept of the core root of the concept of money, i.e. currency, perhaps we can find some useful insights. As a thought experiment, I decided to take a look at the relationship between all of the dollars and all of the gold in the world. This next chart looks at a comparison between the amount of currency and the amount of gold. The US Geological Survey publishes data on world and US gold production, so if you add each year's production to the existing total, you get a view of how much gold there is that has ever been produced. (See also this article for more information on that topic).

It is interesting to see that the vast majority of all the gold ever produced in history has been produced in just the last 50 years. This way of quantifying all of the gold in the world is a little bit imperfect, because some gold is lost each year; the USGS estimates that as much as 15% of annual production gets consumed in industrial use or otherwise lost. But I am going to set that idea aside for the moment.
Gold is priced in units of "dollars per ounce". Suppose we take the idea of "dollars per ounce" to its natural extreme, and compare the total of all actual dollars to the total of all actual gold. What would that look like, and what would it tell us about where gold prices are?
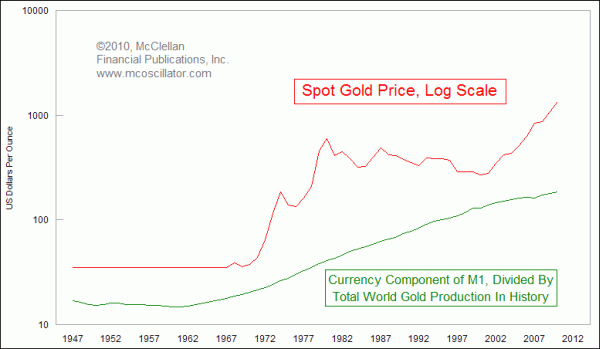
Here is a comparison between spot gold prices, on an annual basis, and the ratio of money per gold.

Both are rising over time, as money gets printed faster than gold gets produced. But they do not grow at a uniform rate. Spot gold, it seems, tends to go farther than it should, then it retraces back to where the liquidity is. So how do we know if gold has gone too far, and has gotten overvalued?
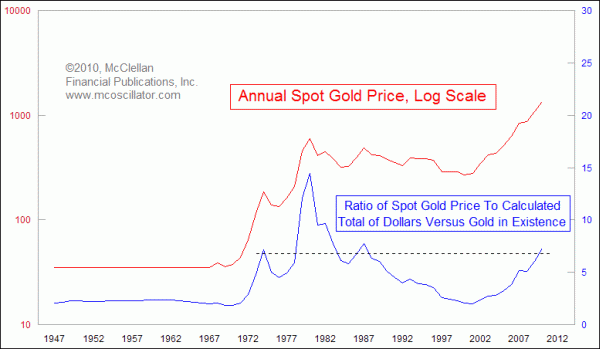
The final chart brings it home. Here we look at the ratio of where gold prices are in the spot market versus the "fundamental" value of gold in terms of the actual number of dollars versus the actual amount of gold.

We can see that the current level (projected numbers for 2010) is not quite up to what we saw at the bubble top in 1980, but it is up as high as we have seen at other sub-bubble tops.
So is gold overvalued? Probably so. But that does not mean it cannot get more overvalued; nor does it mean that gold has to get more overvalued than it is. For insight on that, we should turn to the discussion of the one real fundamental factor that drives gold prices. Investors will tend to push gold up to an overvalued state whenever they perceive that the value of cash money is being undermined. The fact that they push up gold prices faster and farther than the actual inflation of the money supply is an interesting insight into investor behavior. At the point when people start to believe that the money supply is not being undermined further, gold will start to retreat from its overvalued state. But I do not think that people are going to adopt such a belief any time soon, with QE2 proceeding at full speed.
Update: Read this follow up discussion in response to reader questions.
Tom McClellan
Editor, The McClellan Market Report
Jan 08, 2010
The One Real Fundamental Factor Driving Gold Prices |
Feb 19, 2010
Real Yields and the Dollar |
Sep 24, 2010
Gold Priced In Euros Pointing Downward |