Unemployment Rate Will Turn Up

Free Chart In Focus email
Delivered to you every week
It has been a great accomplishment that the unemployment rate has fallen in the 2 years since the misguided Covid shutdown in 2020, and is almost back to the pre-Covid low. But this progress is likely coming to an end right now.
Economists will one day look back, and say that it was the Fed’s tightening starting at the March 16, 2022 FOMC meeting that will get the credit/blame for the coming rise in unemployment. But that rise was already baked in well ahead of the Fed’s actions.
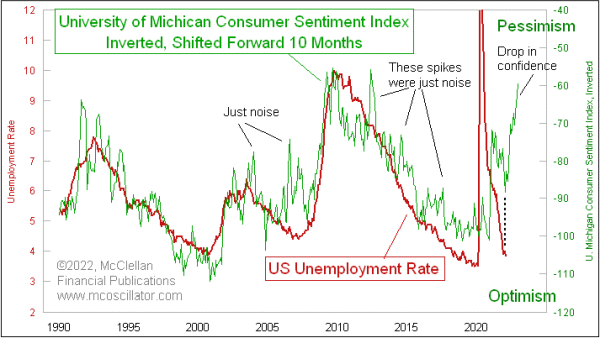
This week’s chart shows a comparison of the U.S. unemployment rate versus an inverted plot of the Univ. of Michigan’s Consumer Sentiment Index. One additional adjustment is that the sentiment data are shifted forward by 10 months, to reveal how unemployment tends to echo those sentiment changes after a lag.
Public sentiment has recently turned much more pessimistic, which is reflected as a rise in the inverted chart plot. That can sometimes just be noise, but this one appears to be an enduring change of sentiment. It therefore is foretelling a rise in the unemployment rate, ideally starting 10 months after the April 2021 peak in confidence.
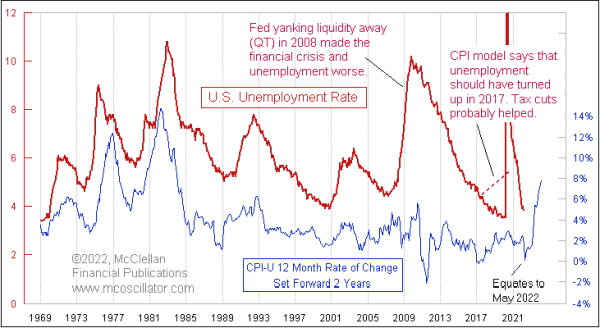
This next chart shows a similar comparison of the unemployment rate and CPI inflation. Here the lead time is 2 years, meaning that the plot of the CPI rate of change has been shifted forward in the chart by 24 months.

It does not always work perfectly. This model had said that the unemployment rate was supposed to start rising in 2017, because of the rise in the inflation rate two years earlier. Instead, the unemployment rate kept falling all the way to the pre-Covid low in February 2020. One can easily argue that the tax cuts implemented in early 2017 helped to bend that curve for the unemployment rate, that is until the Covid shutdown got in the way.
The inflation rate bottomed in May 2020, when lack of demand pushed prices down as people were all staying home. But then people started spending again, fueled by additional government handouts, and the supply chain was not ready for that spending surge so inflation has resulted. The 2-year echo of that inflation bottom equates ideally to May 2022 for a bottom in the unemployment rate.
This is a very slight disagreement between these two models about the timing of an upturn in the unemployment rate. But they are in full agreement about how an ugly rise lies ahead for the unemployment rate. Once that starts becoming evident in the data months from now, the Fed will likely throttle back on its plans for interest rate hikes. But it will take quite a while.
Tom McClellan
Editor, The McClellan Market Report
Sep 21, 2012
Unemployment to Turn Up in 2013 |
Sep 04, 2009
Unemployment Rate Rising On Schedule |
May 28, 2020
Unemployment Is Not “Good”, But It Is Bullish |