Put/Call Ratio Range Shift

Free Chart In Focus email
Delivered to you every week
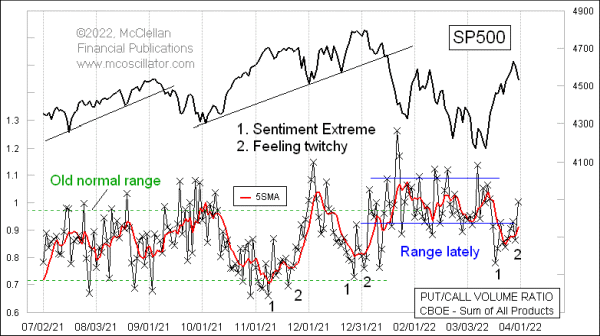
When the market changes its mood, indicators can sometimes change theirs to match. That is the message of this week’s chart.
Traders and analysts have been watching the Put/Call Ratio ever since the late Martin Zweig first called attention to it decades ago. In his 1986 book Winning On Wall Street, Zweig described his research in the 1960s, digging through figures from the Securities and Exchange Commission going back as far as WWII, and noticing that “…when options investors got too optimistic - - buying lots of calls and shunning puts - - the stock market was generally heading for trouble. The reverse was also true.”
The persistent problem over the years has been in determining what constitutes “high” and “low” readings for the Put/Call Ratio. This task is best done in retrospect, but we have to analyze and trade in realtime. And that can be hard.
This week’s chart helps make the point that during most of 2021, there was a pretty well defined range of values for the Put/Call Ratio. One could tell when it got high or low, and thereby indicated a bottom or a top for stock prices.
But when the stock market topped in late December 2021, the options market seemed to shift to a different mode. Suddenly the old definitions of “high” and “low” did not work any more, and a new range seemed to be operative. The SP500’s price bottoms appeared with slightly higher Put/Call Ratio readings, and the countertrend rallies during the downtrend seemed to top out with Put/Call readings that were not as low as before. This is simultaneously both a symptom of a bear market, and a notification that you are in one.
When this new up move got going in March 2022, there was an initial bullish sentiment extreme (#1). But that was not the final word. The March 29 price top and March 30 low reading for the Put/Call Ratio appeared with it at a much higher level, indicating that even though prices were higher, the options traders were already feeling more twitchy. That can be an important tell.
Someday the Put/Call Ratio will likely return to its old normal range, and doing that will constitute a sign that prices have returned to a bull market mode. For the moment, however, the bear market range rules still seem to be in effect. And even though we have seen a strong selloff to end the quarter on March 31, it has not (yet) taken the Put/Call Ratio up to a high enough reading to say that a bottom is at hand.
Tom McClellan
Editor, The McClellan Market Report
Aug 15, 2019
Equity Put/Call Volume Ratio’s 21-Day MA |
May 29, 2014
Equity Options vs. Index Options |
Sep 16, 2021
Seasonal Stress Sparks Sentiment Swoon |