T-Bond Yields Following Gold’s Footsteps
Free Chart In Focus email
Delivered to you every week
Inflation worries are finally getting the attention of investors, and of the Fed, and that has long term rates finally starting to climb. It is weird for anyone who lived in the 1970s and 1980s to see an inflation rate approaching 8%, and long term T-Bond yields are still at 2.6%, and think that this is normal. But at least bond yields are moving.
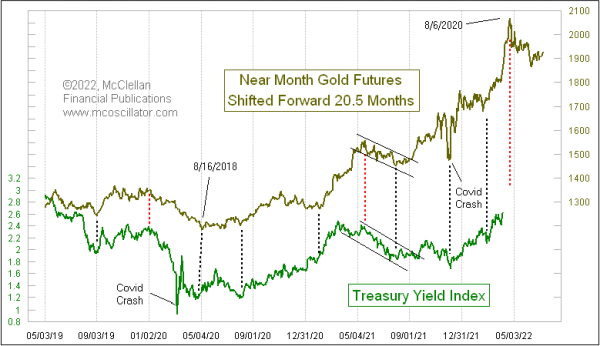
The small amount of the rise in bond yields is a curiosity, but the timing of it is not. Those who regularly read our McClellan Market Report newsletter have known for a couple of years that a big rise in bond yields was coming now, because gold has told us so. The movements of gold tend to get echoed about 20-1/2 months later in the movements of the Treasury Yield Index (TYX), which reflects 30-year T-Bond yields. And a big peak for yields is just around the corner.
Gold prices rushed up to a blowoff top on August 6, 2020. We are now approaching the echo point of that gold price peak for bond yields.
Zooming in closer on this same relationship, we can see that sometimes it is not perfect at explaining the movements of the TYX, and bond yields do not always follow the script exactly.
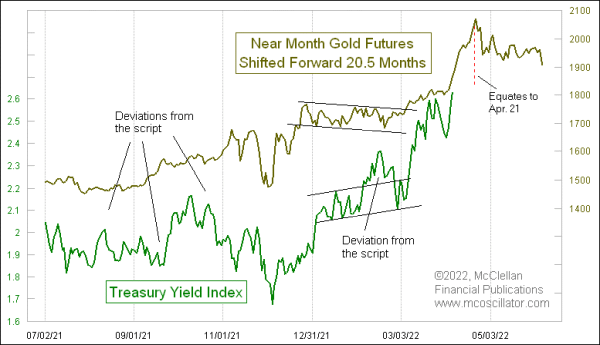
But in those instances when the TYX goes slightly off script, it usually works extra hard to get back on the program afterward. Zooming in this way allows us to see that the gold price top in August 2020 equates to a top for bond yields due around April 21. This model does not tell us at what level of yields this prospective blowoff will finally stop; it is much better at the timing than the magnitudes of the movements.
Gold prices in March 2022 made a valiant effort to equal that August 2020 all-time price high. That implies bond yields will be coming back up to high levels again in around November to December 2023, which is 20-1/2 months after gold’s most recent top.
It is hard to imagine bond yields reaching a peak so soon, with no apparent end to inflation in sight. But that is gold’s message now, and gold has been pretty good at telling us what is going to happen. The news then follows to fill in the story line.
I do not have a good answer to the question of why this leading indication relationship works. How can gold possibly know 20-1/2 months ahead of time what the movements of bond yields are going to look like? If gold is an inflation hedge, then one might reasonably think it would be more of a coincident relationship.
What we think does not govern how the markets actually behave. Our job is to figure out the actual physics of the stock market, and not to prejudge how those physics ought to work. There is sufficient history to show us that this 20-1/2 month lag time between gold’s movements and those of bond yields is a real phenomenon, even if we cannot explain the amount of that lag.
Tom McClellan
Editor, The McClellan Market Report
Jan 14, 2021
Gold Leads Interest Rates |
May 21, 2021
Pause Coming For The Rise In Interest Rates |
Nov 05, 2020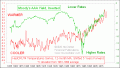
Post El Niño Cooling Means a Bottom Soon For Bond Yields |