VIX Above All of Its Futures Contracts

Free Chart In Focus email
Delivered to you every week
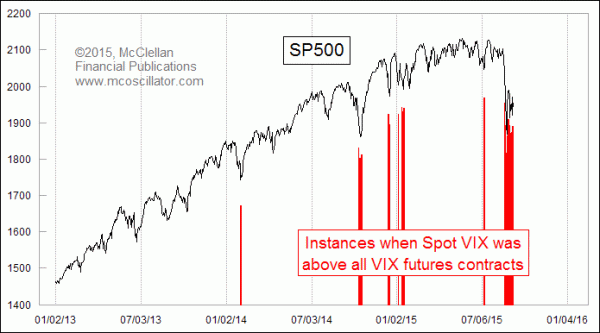
The August 2015 minicrash caused the spot VIX Index to move up above the price level of all of its futures contracts, which currently extend out to May 2016. That is another way of saying that the options traders whose actions determine the level of the VIX are more nervous than the VIX futures traders believe is appropriate.
During a protracted uptrend, it can be a wonderful sign of a short term bottom to see such a development. It says that fear has reached an extreme, and that bottom fishers can do well by taking advantage of the situation. The chart above shows that if someone had “bought” the market at any of the times when this condition has appeared over the past 3 years (at least prior to August 2015), he would have come out really well on the trade.
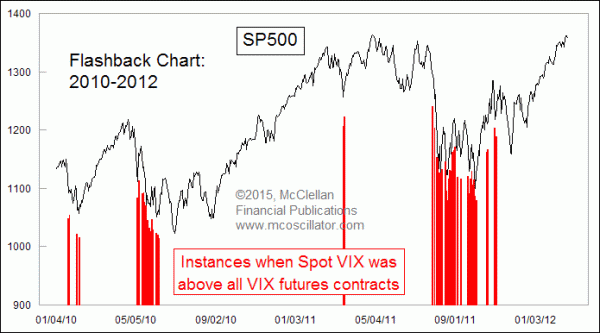
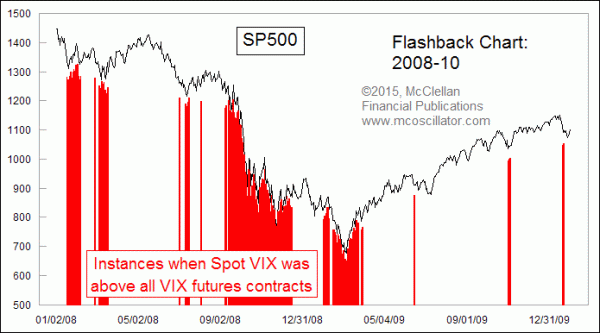
But that is only true during an uptrend. Taking a longer look back shows that during a protracted downtrend, the spot VIX can stay above the level of all of its futures contract for a long time, and it is a really bad idea to bottom fish based on just that criterion. In fact at one point in the autumn of 2008, the VIX was continually above all of its futures contracts for a period of 3 full months.


So the key then for using this insight from the VIX’s action is to know whether you are in an uptrend or a downtrend. That’s really easy to do in hindsight, but much harder to do in real time.
For interpreting this current instance, I am going with the premise that the stock market has indeed had the major top it was supposed to have in 2015, and that it is supposed to be in a downtrend, lasting until April 2016. So the rules of interpretation during downtrending markets should apply, which means that we should not get suckered in by the siren song of a really high spot VIX reading compared to futures.
Tom McClellan
Editor, The McClellan Market Report
Jan 02, 2014
VIX ETN Not Right For Investors |
Aug 21, 2015
Eurodollar COT Says Ugly Drop Is Still Ahead of Us |
Jun 11, 2015
The Magic of 150 Months |