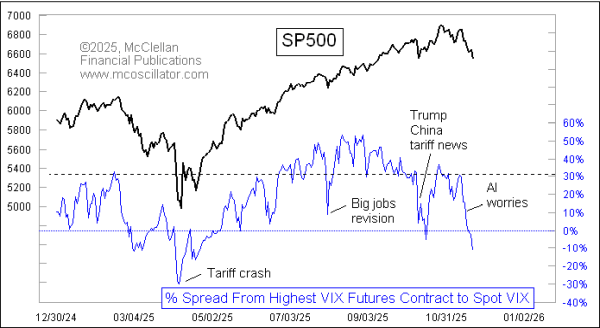
VIX Futures Spread Shows Bottoming Condition
Free Chart In Focus email
Delivered to you every week
The VIX Index was invented in 1989, in a series of papers written by Menachem Brenner and Dan Galai. The CBOE introduced it as an index in 1993, initially using SP100 (OEX) options, but then changing to SP500 options in 2003. See https://cdn.cboe.com/resources/indices/Volatility_Index_Methodology_Cboe_Volatility_Index.pdf for more information on the history of the VIX, and its current formulation.
The CBOE then introduced the first futures contracts based on the VIX in 2004, but those contracts really did not take off and become popular until 2014. The cool thing about having futures contracts on the VIX is that we can use their pricing data as a way to normalize the value of the VIX Index, and that is what this week's chart is all about.
Each VIX futures contract gets settled for cash, since the VIX is not really "deliverable", and this takes place usually on the 3rd Wednesday of each month. VIX futures contracts that expire far into the future are usually priced much higher, because the traders of those contracts have to factor in potential changes in risk levels over a long period of time. Because of that, the most distant VIX futures contract is usually the highest priced contract. As time goes by, and each contract gets closer to its expiration, that price premium will decay and see the futures contract price work its way closer to where the VIX Index is.
Most of the time, the VIX Index is below the prices of all of its futures contracts. That condition results in a positive reading for the indicator in this week's chart, which measures the spread from whichever VIX futures contract has the highest price, vs. the VIX Index itself. Sometimes this indicator gets up to a really high positive value, meaning that the VIX Index is down really far below all of its futures contracts. That condition can be a topping sign for prices, but it is a hard condition to read reliably.
A more reliable condition occurs when the VIX rises up above the prices of all its futures contracts, which results in a negative reading for this spread indicator. We have such a condition now, and these negative readings are great indicators of a bottoming condition for prices. But it is important to note that a "bottoming condition" is not necessarily the same thing as the exact bottom moment.
What this indicator does is to evaluate the current VIX Index reading compared to the baseline of what its futures contracts are doing. Traders of those contracts have to make long term assessments of what risk and volatility are going to look like going out several months. The VIX Index can gyrate around more wildly given worries of the moment, and so making this comparison allows us to quantify where the VIX Index is compared to the assessments by its futures contracts' traders opinions about the future.
At the April 2025 tariff crash low, we saw this indicator get all the way to -30%. The current drop below zero is thus far only to -11%, but that is still a decent oversold condition. It is saying that the rise of the VIX (to 26.42 as of Nov. 20, 2025) has gone on a lot further than the VIX futures traders think is appropriate. This should mark a bottoming condition for the SP500 (eventually).
Tom McClellan
Editor, The McClellan Market Report
Mar 06, 2025
VIX Futures Spread as an Indicator |
Feb 17, 2017
VIX Futures Traders Finally Getting Complacent |
Mar 15, 2023
VIX Index Above All Of Its Futures |