


VIX With Alternate Bollinger Bands
Free Chart In Focus email
Delivered to you every week
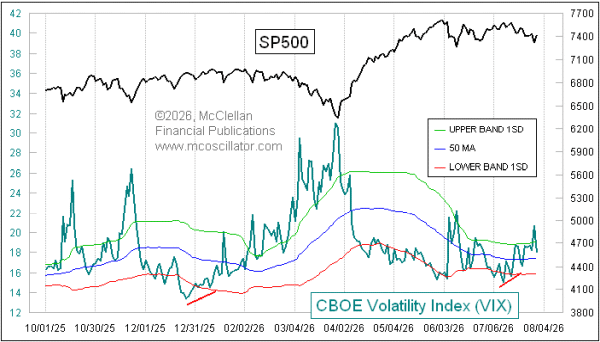
The VIX Index is telling us that there are problems in the stock market. To read that message, one must look at more than just the VIX's numerical value.
Years ago I did some tinkering with using Bollinger Bands on the VIX, and naturally started with the default parameters that almost everyone uses, which are a 20-day lookback period, and bands set 2 standard deviations above and below the 20-day moving average. These settings are known by chartists as "20-2". I started tinkering because I was not satisfied with the messages I was getting from those settings.
What I found was that I liked the chart much better with 50-1 settings, meaning a 50 trading day lookback for the center moving average, and also a 50-day standard deviation. And the -1 means that the Bollinger Bands are set just one standard deviation above and below. I cannot quantify exactly why I liked these settings better, but along the way I learned some interesting things about what the VIX has to tell us.
Right now, the VIX is above its 50MA, which is where the VIX spends time during downtrends in the SP500. So just that one observation about the VIX versus its 50MA can be a useful piece of information. And as with any comparison to a moving average, there can come a point when the VIX gets extended really far away from that 50MA, which marks an extreme point for prices. I do not see such an extreme at the moment.
In looking at that relationship of the VIX to the 50MA, I also noticed that the behavior of the upper 50-1 Bollinger Band was an important piece of information all by itself. If that upper band is falling, that is a bullish condition. If it is rising, that is bearish.
Here is a chart showing just that upper 50-1 Bollinger Band compared to prices.
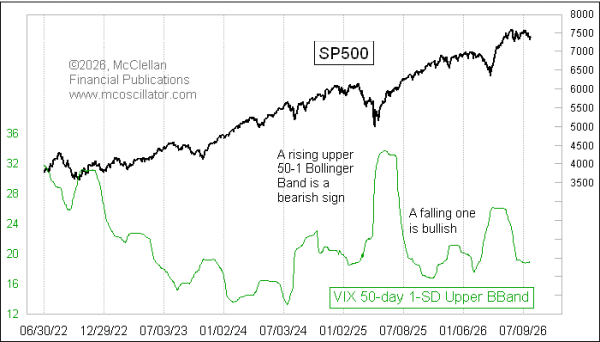
If you look closely enough at that chart, you can see that the green line is starting to rise. That is a bearish signal for the SP500.
As with any bullish/bearish signal, this one could decide to reverse itself at any moment. And it will not tell us how much of a price move we might see. It just says that there is a problem in the stock market, which is being revealed by the subtle movements of the VIX Index. The last upturn started on Feb. 10, 2026, and it correctly told us about the problems that resulted in the March 2026 correction. Other upturns in the past did not result in as much price damage.
The movement of the upper 50-1 Bollinger Band depends on two separate factors. First, what is the VIX's 50MA doing, and second, what is the 50-day standard deviation of the VIX doing. Lower VIX levels push down the 50MA, and quieter VIX action results in a shrinking standard deviation. So the upper 50-1 band is combining both of those messages into one indicator, which is not perfect, but which has some really interesting messages.
Tom McClellan
Editor, The McClellan Market Report
Jul 23, 2026
Gold’s 20-1/2 Month Leading Indication for Yields |
Nov 20, 2025
VIX Futures Spread Shows Bottoming Condition |
Jul 14, 2021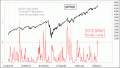
A Useful Misuse of Correlation Coefficient with VIX Index |