Waiting on the Echo of Crude Oil’s Big Drop

Free Chart In Focus email
Delivered to you every week
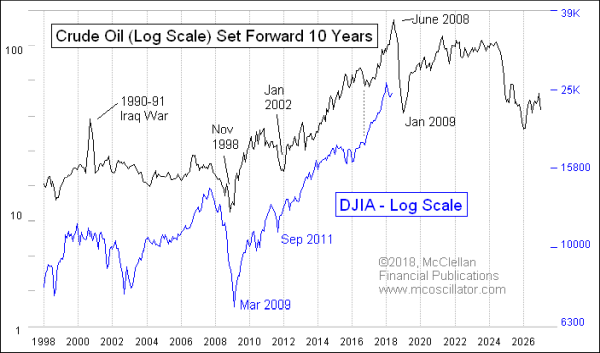
10 years ago in June 2008, oil prices were making a top above $140/barrel, which turned out to be an exhaustive blowoff top. A steep collapse ensued, taking oil prices down to below $40 in January 2009.
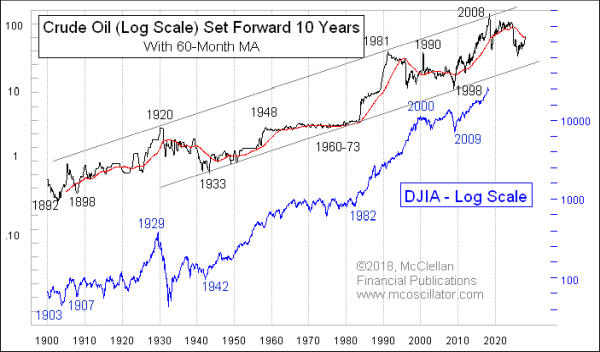
Crude oil gives us a 10-year leading indication for what the stock market is going to do. It is a phenomenon which has only been working for the entire 122-year history of the DJIA, so that may not be long enough yet for some people to believe in it. Making things more complicated, it is not a precisely perfect model of future stock market action. It is merely very good.

The implication of the 10-year leading indication relationship is that we should see the echo of that oil price drop in 2018.
Now here is the problem: The 10-year lag period is not precise. It can vary from 9-1/2 to 10-1/2 years. And when a government or OPEC puts a thumb on the scale, the relationship can get skewed.
As an example, in 1990 the government of Iraq decided it was entitled to annex “the 19th province,” i.e. Kuwait. That understandably caused a bit of turmoil in the oil market, causing oil prices to spike from $20 to $40 a barrel, and then collapse back down again after the “mother of all battles”. The DJIA 10 years later did not echo that brief spike exactly, but did generally follow the pattern of oil prices minus that exogenous spike.
In 2008, there was a huge commodities bubble, as hedge funds suddenly embraced commodity indexing after they realized that the stock market and housing market were not going to be great places to invest. That helped to send oil to $145/barrel. But it left the as yet unanswered question of whether the 2008 commodity bubble top was another example of an exogenous blowoff which should be discounted.
We will have that answer within the next year or so, which is wonderful for the history books, but not so good for trading. If the DJIA was going to match the oil price pattern exactly, then we would see a price top for the stock market in June 2018 and a sharp drop to a bottom due in January 2019. But as we have seen, the match is not exact.
My guess at the moment is that the DJIA’s Jan. 26, 2018 top is the early answer to oil’s June 2008 price top. And so a 6-7 month decline should unfold, leading us to a stock market bottom due sometime in late summer. That is assuming that the recent tendency of the turning points to be early versus a 10.0-year lag persists for a while. That is a big assumption.
I will be turning to other tools to nail down the exact timing of the 2018 stock market decline and rebound, since trusting oil’s action of 10 years ago to give us exact answers is taking it beyond its historically demonstrated abilities. The deeper message for us to take from oil’s action right now is that after the 2018 decline, there WILL be a big price rebound for stocks into 2019 and beyond. It probably will not feel like such a rebound is going to be possible as the market is putting in its bottom later this year, but that’s exactly the nature of how bottoming moments feel.
Tom McClellan
Editor, The McClellan Market Report
Apr 05, 2018
Backmasking The DJIA’s Price Pattern |
Nov 02, 2017
Crude Oil Backwardation |
Feb 23, 2017
Crude Oil Foretold the Trump Rally 10 Years Ago |