What Happens to Gold When Real Yields Go Too Far

Free Chart In Focus email
Delivered to you every week
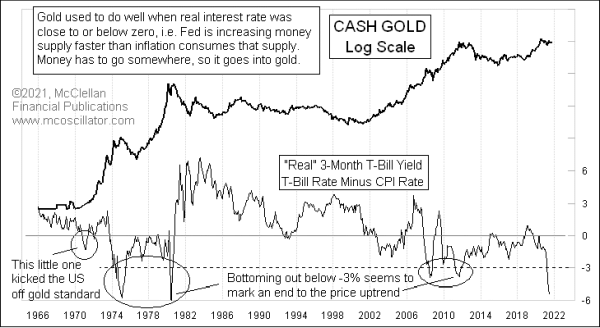
Gold analysts have long “known” that the real interest rates have an effect on gold prices. By “real” interest rates, I am referring to the inflation adjusted interest rates, which in this week’s chart is represented by the 3-month T-Bill yield minus the CPI Inflation rate. The current T-Bill yield is +0.05 (hey, at least it is a positive number), and the latest CPI data show prices up 5.37% from a year ago. So the difference between those two is -5.32%.
Gold was first traded freely in the U.S. beginning in 1975, and since then it has been demonstrably well correlated (negatively) with the real T-Bill interest rate. There was even a brief moment of negative real rates back in 1970-71 that put enough pressure on the dollar to kick the U.S. off the gold standard. Since then, episodes of negative real rates have been fairly well correlated, but with a twist.
Rates that are a little bit negative are stimulative to gold prices going higher. But if the spread gets too big, that tends to stifle further progress. It is almost like it is too much of a good thing. The -3% threshold seems to be the boundary line for this effect. Excursions below -3% tend to mark important tops for gold prices, or at least that has been the case for the past 37 years. Maybe this time will be different.
So why would this matter? A big negative real yield is a sign of a huge imbalance in the banking system, and horribly misguided Fed policy. It says that the Fed is WAAYYYY behind the power curve, and has let inflation get away from them.
When that happens, the natural reaction is for the FOMC to start raising short term rates, trying to get the genie back into the bottle. It is the hiking of the short term Fed-controlled rates that does the work of discouraging people from owning gold. Higher interest rates mean that a gold investor misses out on that much more money which he could have earned in a bank account or CD, instead of in gold. It is also the anticipation of those rate hikes that gets gold traders moving the price down in advance of the actual Fed action.
The very real question (and that does not mean an inflation-adjusted question) right now is about whether the current Fed is not going to do its job, and respond as it would have in the past to a ridiculous spread between the inflation rate and its short term interest rate targets. We arguably have a Fed whose honchos are collectively stupid enough to not only think that 2% is their goal (statutorily it is 0%), but who also think that 5%+ is just “transitory” and so they don’t need to do anything about it.
This arguably changes the dynamic involved in this week’s chart. If a big negative real yield is an indicator of what the Fed is about to do that will hurt gold prices, but if we now have a Fed which cavalierly ignores market conditions, then does this indication really still work as an indicator for gold? That is a legitimate question. And a troubling one, to contemplate having a Fed which refuses to do its job.
Tom McClellan
Editor, The McClellan Market Report
Oct 27, 2011
Negative Real Yields, Too Much of a Good Thing |
Jan 08, 2010
The One Real Fundamental Factor Driving Gold Prices |
Jul 02, 2021
Gold and Dollar Share an 8-Year Cycle Period |