Gold and Dollar Share an 8-Year Cycle Period

Free Chart In Focus email
Delivered to you every week
There is an important 8-year cycle operating in both gold prices and the dollar. That part makes sense, since a rising dollar tends to be harmful to gold’s prospects. But it is more complicated and interesting than that. And it is not exactly the same 8-year cycle operating in both of them.
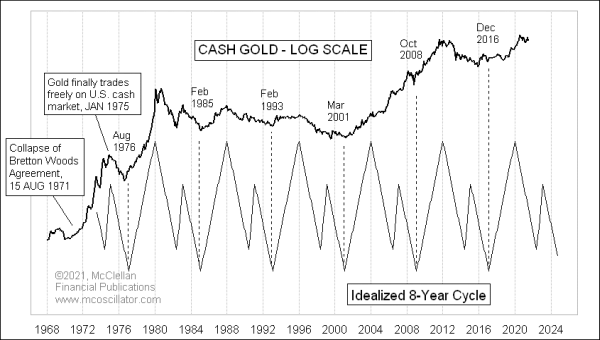
This week’s lead chart shows my version of the ideal 8-year cycle pattern in gold prices. I first synthesized this back in 2003, and it has kept working pretty well since then, for the most part. It consists of a strong 3-year up phase, followed by a more complex 5-year downward phase. We are currently in the early portion of that 5-year downward phase right now. That means gold prices should ideally keep working their way lower toward an important bottom due in late 2024 to early 2025. The exact lows have ranged from August of the years divisible by 4 to February of the following year, at least during the period of time for which we have usable data. Gold only became tradable in the USA starting in January 1975.
The 2000s showed a unique anomaly which tests this pattern hypothesis. There were indeed bottoms in March 2001 and October 2008, which fit nicely with the 8-year cycle lows. But the 5-year downward phase did not really work then, as the artificially lowered interest rates courtesy of the Federal Reserve helped to fuel a major bull market in gold prices. The other cycles have seen the 5-year down phase work according to the pattern’s hypothesis.
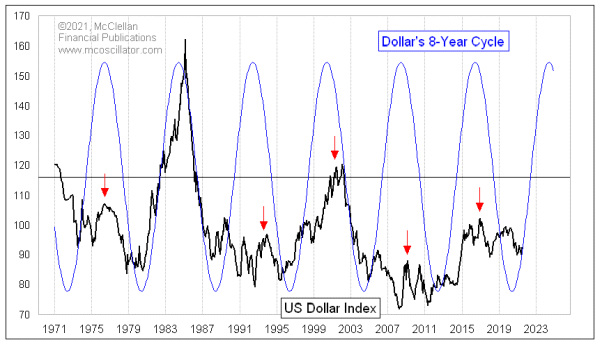
The Dollar Index seems to also follow its own 8-year cycle, albeit slightly out of phase with gold’s version. And it is not the same 3-up, 5-down pattern. Here is the US Dollar Index with a more conventional 8-year sine wave depiction.

This cycle suggests that the Dollar Index should be heading upward now toward a cycle top due around 2024. I could calculate it more precisely than that, but it would be rather pointless since the actual tops are not always terribly punctual.
A presumably rising dollar value will put downward pressure on gold prices, since a more valuable dollar can buy more gold, all other things being equal. So that fits with the 8-year cycle for gold prices, calling for a decline to a low due in 2024-25.
No one should expect that either trend, in gold or the dollar, should be in a straight line. History shows that their trends do not work that way. But it is still worth knowing what the underlying trend is supposed to be, so that one can know whether to trade with that trend or against it.
Tom McClellan
Editor, The McClellan Market Report
Dec 29, 2017
Gold’s 8-year Cycle |
Jun 17, 2021
Tin Has a Message For the Dollar |
Aug 20, 2020
Commercial Traders Are Long Dollar Index Futures |