Why Are Bond Yields Staying Low?

Free Chart In Focus email
Delivered to you every week
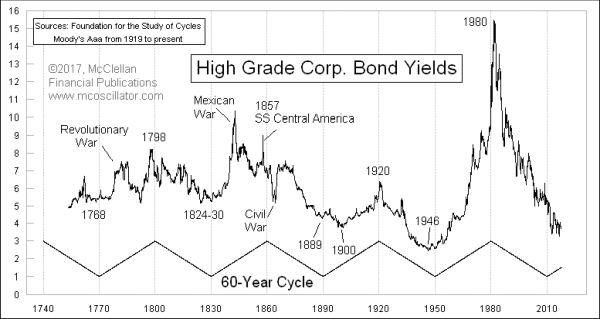
There is a 60-year cycle in bond yields which has existed since bonds first came about in the 1700s. It says that bond yields should have ideally bottomed in 2010, and by now we should be well into a 30-year rise in yields lasting until 2040.
But that is not how it has worked out. Bond yields have stayed low 7 years beyond the ideal bottom date. So is something wrong, or is the cycle broken? Or perhaps is this just an normal sort of anomaly?
We have seen prior examples of bond yields bottoming a bit off schedule. There was supposed to be a yield bottom in 1890, but bond yields waited until 1900 to finally bottom. Wars, ship sinkings, and other human events have also skewed the cycle a bit. So this current delay could just be another example of a delay in this cycle bottom’s arrival.
Or there could be a deeper explanation. We tend to think of the Fed as the authoritative controller of interest rates, something which I debunked at this link. A study of long-term historical data shows that another agent is more powerful than the Fed. Sorry if that last sentence sounds like economic heresy. But do you want to believe what your econ professor taught you, or what the data say?
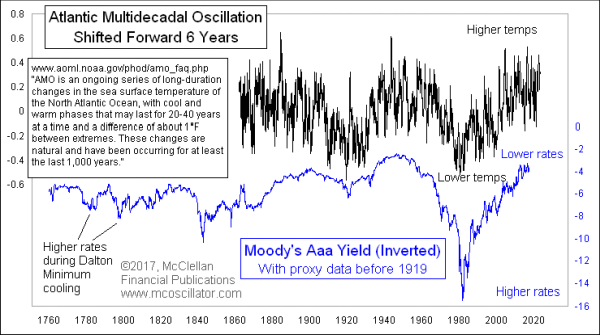
The 60-year cycle also appears in global climate data. One place where it shows up best is in a bit of data known as the Atlantic Multidecadal Oscillation (AMO).

According to this 60-year cycle, global average temperatures should have turned down by now, and made for a cooling planet like we had in the 1970s. Cooler temperatures mean more freezing events, poorer crop yields, and thus higher prices and inflation rates which bring higher interest rates. But temperatures have not turned down, which means that former Vice President Al Gore still has a complaint, and thus a business model.
And it also means that interest rates have remained low (show as high readings on this inverted scale chart). The movements of global temperatures, as modeled by the Atlantic Multidecadal Oscillation, tend to lead the movements of long term interest rates by about 6 years. If we are going to see a rise in interest rates, we should expect to see a drop in temperatures beforehand.
There is a lot of noise in the (monthly) temperature data, but this is a long enough chart to see the trend. And we see that the AMO data tend to lead the interest rate trends by about 6 years. The AMO data do not go back to before 1856 (reliable thermometers were still being perfected), and so we cannot see what it would have said about the little ice age in the late 1700s and early 1800s known as the Dalton Minimum.
As for why this relationship between temperatures and interest rates works, my hypothesis is that it is because cooler temps are bad for crop yields, causing higher food prices which trickles into other price data, and thus pushing up interest rates. I cannot fully explain the reason for a 6-year lag.
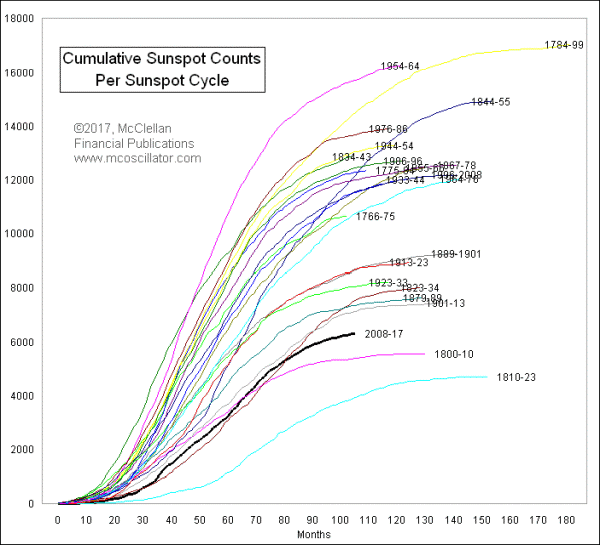
As for the 1890 cycle low not arriving until 1900, the 1890s were pretty warm. But then colder temps (and a quiet sunspot cycle) in the 1900s led to rising wheat prices, the creation of the Fed, and WWI. This latest sunspot cycle has been the quietest one since that Dalton Miminum.

Eventually that lower solar output that the planet is receiving should start to matter in terms of cooler temperatures, poorer crop yields, and thus higher inflation and interest rates. Delaying an event that the cycle says should happen does not necessarily negate the cycle; it can instead postpone the work to be done, forcing the commodities markets to work extra hard to make up for lost time. And that should lead interest rates to start the delayed rise toward a top in yields due in 2040.
Tom McClellan
Editor, The McClellan Market Report
Jul 07, 2016
NIRP Disrupting 60-Year Cycle |
Jan 19, 2017
High AMO Says Rates Should Stay Low |
Aug 27, 2010
60-year Cycle In Interest Rates |