2-Year T-Note Should Guide The Fed

Free Chart In Focus email
Delivered to you every week
Milton Friedman once famously quipped that, "I have, for many years, been in favor of replacing the Fed with a computer." Speaking in a 1999 interview, Friedman went on to add, "The Fed has had very few periods of relatively good performance. For most of its history, it's been a loose cannon on the deck, and not a source of stability."
12 years after that interview, the problems of the Fed are still the same. The FOMC sets interest rates at its whim instead of where the market shows that they need to be set, and this causes excitation and repression of the business cycle at the wrong times. This results in economic dislocations and misallocation of assets which do not help the economy.
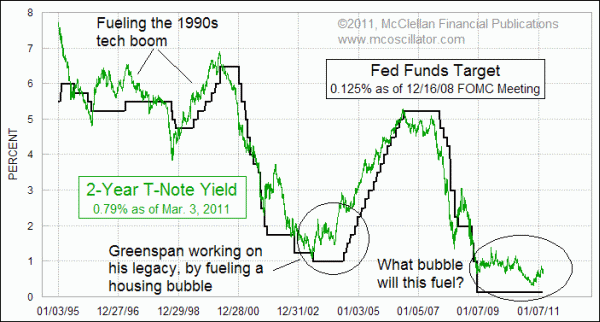
In this week's chart, I compare the 2-year Treasury Note yield to the Fed Funds target rate. One could use other short term rates for this comparison, but I have found that the 2-year yield seems to do the best job of indicating what the Fed should do. And the 2-year yield does a great job of indicating ahead of time what the Fed is going to do. If the Fed would just set the Fed Funds target close to the 2-year yield, we would see a lot more stability in the financial markets.
For two periods back in the 1990s, the FOMC kept the Fed Funds target well below the 2-year note yield. The result was a great period for stock market investors, as all of the extra liquidity helped to fuel the tech boom. In between, the Fed was asleep at the switch for a while in 1998, missing the dip in 2-year yields that was underway. That led to an illiquidity crisis which brought us a Russian debt default and problems for the world's stock markets in late 1998.
When the tech bubble broke in 2000, the Fed was too slow in reacting, keeping its rate well above the dropping 2-year note yield most of the way down. And in 2003-05, when the outgoing chairman Alan Greenspan was said to be worried about his legacy, he kept rates well below the 2-year note yield, thereby helping fuel the real estate bubble.
In 2006, the 2-year yield signaled that there was trouble brewing well before the peak of the stock market in 2007. It moved below the Fed Funds target, and the Fed under Bernanke failed to take notice of that warning. By the time that the FOMC finally lowered the Fed Funds target from 5.25% to 4.75% in September 2007, the 2-year note was already down to below 4%, showing that the Fed was way behind the power curve.
Now, the 2-year T-Note yield is hovering around 0.75%, the Fed insists on keeping the Fed Funds target at 0% to 0.25% "for the foreseeable future". One effect has been to push up gold prices, which in turn has pushed up general commodities prices after about a 4-month lag.
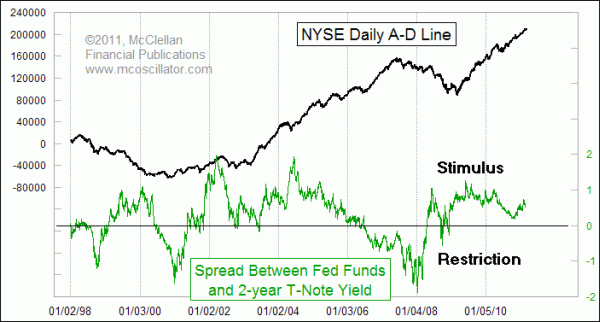
Another effect has been to help stimulate a doubling of the stock market indices from their March 2009 low. This next chart takes that spread between the 2-year yield and the Fed Funds target and puts it into an easier to read indicator.

A positive reading for this spread means that the 2-year yield is above the Fed Funds target, or that the Fed is keeping rates lower than it should. This condition tends to be very stimulative to the stock market, as evidenced by the movements of the NYSE Advance-Decline Line. When the Fed sets short term rates too high, meaning higher than the 2-year note yield, this indicator goes negative and it is a restrictive condition for market liquidity. It can take a few months before that stimulus or restriction is manifested in stock prices, but the pressure is there.
Continuing to maintain this big imbalance between what the FOMC decrees and what the market knows is having the same overstimulation effects that the Greenspan Fed did in the 1990s and in 2003-04. Perhaps now is finally the time for Milton Friedman's metaphorical computer to take over monetary policy, and start setting short term rates where the bond market suggests it needs to.
Tom McClellan
Editor, The McClellan Market Report
Oct 22, 2010
Get Ready For Higher Interest Rates |
Jan 08, 2010
The One Real Fundamental Factor Driving Gold Prices |
Jul 31, 2009
Spread between 2-year yield and FF rate |