Oil Spike Eases Big Contango

Free Chart In Focus email
Delivered to you every week
The political unrest in Tunisia, Egypt, and now Libya has caused a big upward spike in oil prices, as especially the European oil markets worry about interruptions of supplies. The events that caused the oil price spike are not as predictable as the rise itself, which was forecasted by the indicator in this week's chart.
"Contango" is the term used to describe how commodities futures prices for different delivery months have different current prices. Under a normal contango situation, the prices will be higher for delivery months in the distant future. Usually it reflects the "time value of money" and thus will be related to the level of short term interest rates.
"Backwardation" refers to the unusual situation in which the near month contracts and the spot price are higher than the prices for the more distant months.
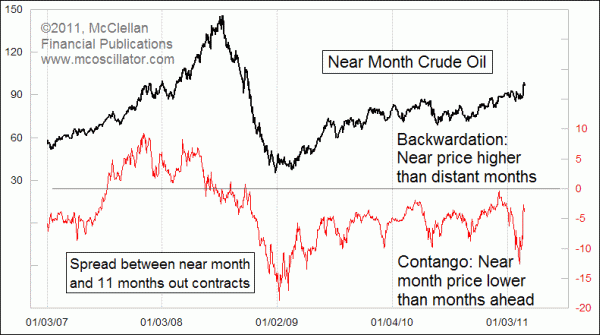
This week's chart looks at how contango and backwardation in oil futures prices has changed over time. Oil futures have been continuously in a state of contango (negative indicator) since just before the bottom in early 2009. When contango gets really extreme, such that spot prices are well below the prices of distant delivery months, then the oil market sees all sorts of strange behaviors, such as a building boom for storage tanks at the Cushing, Oklahoma delivery point, or the rental of oil tankers which are just anchored to wait for the distant contract month to arrive. All of these activities have costs, but if the contango is big enough then there is enough money in the spread to pay for them.
As recently as February 9, 2011, we saw the March 2011 contract for light sweet crude priced at $86.99 per barrel, while the February 2012 contract was priced at $99.53. That is a spread of $12.54. If you had a place to store that oil, you could have bought it on the spot market for around $87 and sold a February 2012 contract, collecting a guaranteed return of 14.4%. Imbalances that big do not stick around for very long.
And big imbalances like that are also an indication that a turn in the near month price is very likely. The very low indicator reading reflecting that big contango appeared just before the big price spike related to middle east unrest. In the process, the big disparity between near month and far month prices has eased quite a bit, taking this contango indicator up to near the highs of its recent range.
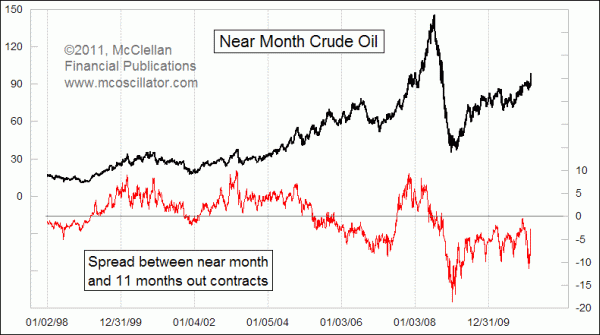
When we look at a longer term view of this indicator, we can see that the range of values is something that varies over time. Since 2009, readings above -5 have marked oil price tops and readings below -10 have marked price bottoms. But at other points in history, one would have needed to apply different thresholds for "high" and "low" readings in this indicator.

From 2000-2004, this indicator remained mostly above zero, meaning that oil futures contracts were in "backwardation". During that period, readings down near zero marked good price bottoms while readings above +5 marked price tops. So if one is going to use this indicator to help with timing oil price moves, then one must be aware that ranges of values vary over time.
If we think with a long term perspective, then the fact that oil futures contracts have been in a persistent state of contango (negative indicator readings) is a sign that we are likely not done with this long upward trend for oil prices, even though we may be done with the Libya-related pop.
Tom McClellan
Editor, The McClellan Market Report
Dec 10, 2010
After The Rogue Wave |
Oct 14, 2010
Gold Prices Lead The Way For Commodities |
Feb 26, 2010
Oil’s Leading Indication for Stocks |