A Curious Backwardation Behavior in Oil Futures

Free Chart In Focus email
Delivered to you every week
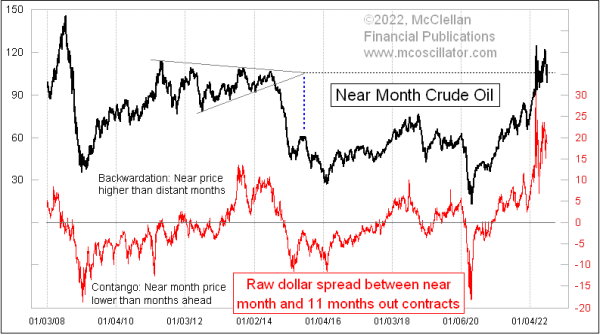
Crude oil futures prices peaked on June 8, 2022, at a closing price of $122.41/barrel for the near-month contract. Since then, prices have fallen 24 points to a closing price of 98.13 on July 6. It is not at all unusual to see such price volatility in the midst of a supply squeeze.
What is unusual is that we are seeing a similar price drop throughout the crude oil futures market. Normally a supply squeeze will affect just the near month contract, meaning the one closest to expiration, and perhaps the next one or two contracts in succession. The far out month contracts, which do not mature for several more months, typically do not manifest the high volatility of the near month contracts during a supply squeeze. And so as the supply squeeze starts to abate itself, and supply/demand forces start to get back into balance, the premium of the near month contract over those far into the future starts to dissipate.
That is the normal model for how things work. But things are not working that way right now.
The crude oil futures market has been in a pretty severe condition of “backwardation”, meaning that the price of the near month contract is far above the prices of those contracts further out into the future. I show that in this week’s chart, which measures the spread between the current month contract price and that of the contract 11 months out. A supply squeeze puts a premium on oil that can be delivered now, and that turns into a big positive spread in the chart, showing as “backwardation” of the contract pricing.
A more normal condition is to have farther out contracts priced higher than the near month contract, and that is known as “contango”. A large contango condition in the crude oil futures market is a pretty good sign of an important price bottom.
Similarly, a large condition of backwardation is a sign of a price top. And sure enough, the big backwardation condition we have just been seeing recently in 2022 has now led to a big price drop, taking oil prices back below $100/barrel. But it has come with a proportionate drop throughout the maturity spectrum of oil futures, meaning that the far out months are dropping almost as fast. That is resulting in oil maintaining a pretty large condition of backwardation.
The implication is that there is going to be even more of a decline in crude oil prices, because the near month price will need to naturally contract back downward to meet where the far out month contracts are priced, just to get back into equilibrium. But that equilibrium is running away as fast as the near month contract can chase it.
There is one more interesting point in this week’s chart. For several years now, I have been expecting that the $105/barrel price level would someday display some importance for oil prices. That expectation arose out of noticing that a nearly symmetrical triangle had formed in oil prices from 2011-2014. The apex of that triangle structure was at the $105/barrel level, and apices can have future importance either in terms of timing, or of price. Sometimes an apex will display importance in both ways.
In this case, the moment of the apex in mid-2015 marked the peak of a countertrend rally in oil prices, which was pretty interesting. But the price level of the apex also should have mattered, and I suspect it would have mattered more precisely had the Russian invasion of Ukraine not intervened to disrupt things. As it was, the chopping around in oil prices at a high level since that invasion has been happening centered on the 105 level, a behavior which I believe is honoring the message of that triangle apex.
Sometimes there is fascinating symmetry in the price charts.
For now the message of the continued backwardation is that there is still more room for oil prices to decline in the coming months.
For more on the topic of backwardation and contango, see these articles from our web site’s Learning Center:
https://www.mcoscillator.com/learning_center/kb/market_data/backwardation_and_contango/
https://www.mcoscillator.com/learning_center/kb/economic_relationships/contango_backwardation_in_oil_and_gold/
Tom McClellan
Editor, The McClellan Market Report
Jul 19, 2013
Huge Backwardation In Crude Oil |
Mar 22, 2018
Crude Oil Swooping Up On Schedule |
Jul 16, 2020
Crude Oil: Uptrend to October |