Backwardation and Contango
I keep hearing people talking about “backwardation” in the commodities markets. What are they talking about?
Backwardation means that forward contracts are priced lower than nearer term contracts, or spot, and when it occurs it is a sign of price deflation to come. As an example, suppose you could buy gold today (Dec. 8, 2008) for $700/oz, and suppose the June 2009 contract were priced at $690/oz. That means gold today is worth more than what the futures market says it is going to be worth in the future. This sort of condition typically happens due to momentary supply shortages in a spot market for “soft” commodities, especially natural gas or oil.
When the 2005 hurricanes slammed the Gulf Coast, there was huge backwardation in the natural gas market, and for good reason. People who really needed natural gas supplies right now were willing to pay up for it in light of the shortages caused by the hurricane. But the futures markets did not believe that such supply shortages were going to be long-lasting, and priced forward contracts more appropriately in expectation of a return to normalcy.
There was an erroneous report circulating on some financial web sites in December 2008 stating that gold had gone into backwardation. This was not actually true, and it stemmed from a misunderstanding about the inefficient pricing of “spot” gold, meaning gold bullion sold in the cash markets instead of the futures markets.
The opposite condition to backwardation is “contango”, and it is the normal condition for most futures markets, especially for gold. Here are Friday’s (Dec. 5, 2008) closing prices for gold futures contracts:
spot: 749.00 (basis Handy & Harman NY fix)
Dec: 750.50
Feb: 752.20
Apr: 753.70
Jun: 755.20
Aug: 756.80
Oct: 758.70
A quick look at the numbers shows progressively increasing prices the further into the future you go, and this makes sense. Usually, the amount of increase in forward pricing depends on interest rates, because the arbitrageurs keep it that way.
Looking at those prices for Friday, suppose that the Oct. 2009 contract were priced at $800/oz instead of 758.70. Someone could buy some spot gold, store it for 10 months, and sell a futures contract for Oct 2009 delivery. He would pocket $51 profit on that transaction. That would be an 8.17% (annualized) return on his investment in spot gold, which is better than he could earn on just about any other “safe” investment, and so a lot of arbs would jump on that opportunity and keep jumping on it until it went away. That is why the October contract is down much closer to spot. Gold is also going to see better pricing efficiency this way because it is easier to store gold than to store say 100,000 bushels of wheat.
One other way to get into trouble thinking about backwardation in gold is by looking at the different quotes for “spot”. WSJ says that on Friday (Dec. 5, 2008), the Handy and Harmon NY price was 749.00. But they also list these other quotes for spot gold:
750.92 Engelhard industrial bullion
807.24 Engelhard fabricated products
749.00 Handy & Harman base price
808.92 Handy & Harman fabric price
771.75 London a.m. fixing
749.00 London p.m. fixing
797.12 Krugerrand, wholesale-E
797.12 Maple Leaf, troy oz.-E
797.12 American Eagle, troy oz.-E
914.69 Mexican peso, troy oz.-E
740.11 Austria crown, troy oz.-E
797.12 Austria phil, troy oz.-E
The morning fix in London was much higher, reflecting where gold prices were in the US futures markets on Thursday of last week. So choosing which fix to use is important. There can also be movement of the futures markets after the spot prices is “fixed”, resulting in more pricing inefficiencies that are not actually reflective of reality.
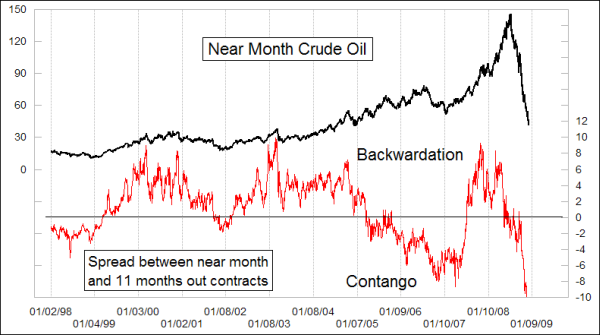
To see why backwardation and contango are important, look at the chart below, showing the spread between the current near month crude oil contract and the one that is 11 months out.

Right now, oil futures are in an extreme condition of contango which implies that oil prices are oversold and bottoming. The actual spread is -13.84, which is below the Y scaling in this chart, and that is in dollars not percent! In other words, oil traders are pricing Dec. 2009 delivery at $54.65, which means that they really don’t think we are going to see oil prices stay in the 40s.
The last point is that there is a great article by Cynthia A. Kase, CMT, on this topic in the October 2008 MTA newsletter (for MTA members). She did an extensive study of “calendar spreads”, and found that for the most part, price spreads between contracts are not uniformly predictive, but as the crude oil chart shows, they can have important information about the future when they go to extremes.