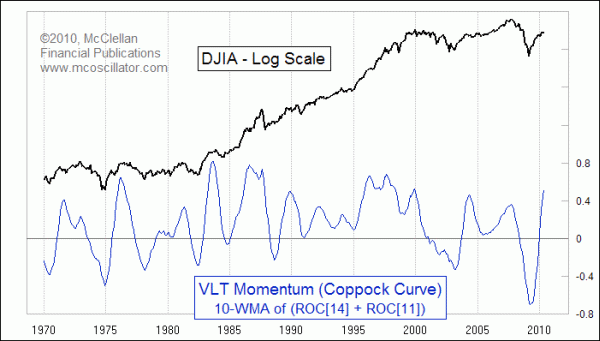
Calculating The Coppock Curve
I have heard about the “Coppock Curve” but I cannot find it on my charting program. Do you know how it is calculated?
The Coppock Curve was developed in the 1960s by the late E.S.C. (Sedge) Coppock. He called it his Very Long Term (VLT) Momentum Index.
It is calculated by finding the 11-month and 14-month rates of change (ROC) of the DJIA, adding them together, and then calculating a 10-month weighted moving average (WMA) of the result. It is effectively a really long term price oscillator, since it first uses monthly closes for the DJIA, or for any other index, and since it uses a long lookback period.

Coppock used the 11-month and 14-month periods because he had once been told by an Episcopal priest that the typical period during which a person grieves over the loss of a loved one is 11 to 14 months. Coppock hypothesized that human psychology related to investment losses was similar to the grieving process, and so he sought to use that time period in creating an indicator that would help him find the really important long term price bottoms.
You can download an Excel spreadsheet file to help you calculate the level of the Coppock Curve for the DJIA on an ongoing basis, including a calculation of the DJIA level at which the Coppock Curve would change direction (Coppock Unchanged).