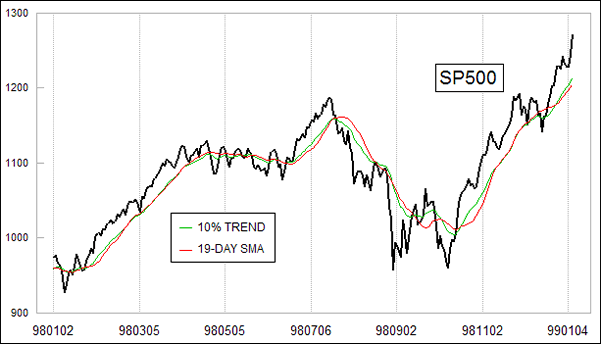
Exponential Versus Simple Moving Averages
Hi Tom - I am a subscriber of yours and was wondering if you had a “conversion” chart for converting trend value % into period exponential MAs. for example, 10% Trend is roughly equal to a 19-period EMA, 1% Trend to 200EMA etc. Thank you in advance.
The formula for converting an exponential moving average (EMA) smoothing constant to a number of days is:
2
———-
N + 1
where N is the number of days. Thus, a 19-day EMA would fit into the formula as follows:
2 2
————- = ———- = 0.10, or 10%
19 + 1 20
This stems from the idea that the smoothing constant is chosen so as to give the same average age of the data as would be had in a simple moving average. If you had a 20 period simple moving average, then the average age of each data input is 9.5. One might think that the average age should be 10, since that is half of 20, or 10.5 since that is the average of the numbers 1 through 20. But in statistical convention, the age of the most recent piece of data is 0. So finding the average age of the past twenty data points is done by finding the average of this series:
0, 1, 2, 3, ... 18, 19
So the average age of data in a set of N periods is:
N - 1
————-
2
For exponential smoothing, with a smoothing constant of A, it turns out from the math of summation theory that the average age of the data is:
1 - A
————-
A
Combining these two equations:
1 - A N - 1
——— = ————
A 2
we can solve for a value of A that equates an EMA to a simple moving average length as:
2
A = ————-
N + 1
Read more about the origins of Moving Averages.
You can read one of the original pieces ever written about this concept by going to McClellan_MTAaward.pdf. There, we excerpt from P.N. Haurlan’s pamphlet, “Measuring Trend Values”. Haurlan was one of the first people to use exponential moving averages to track stock prices back in the 1960s, and we still prefer his original terminology of a XX% Trend, rather than calling an exponential moving average by some number of days. One big reason for this is that with a simple moving average (SMA), you are only looking back a certain number of days. Anything older than that lookback period does not factor into the calculation. But with an EMA, the old data never disappears; it just becomes less and less important to the value of the moving average.
