AAII Survey Shows Sentiment Washout

Free Chart In Focus email
Delivered to you every week
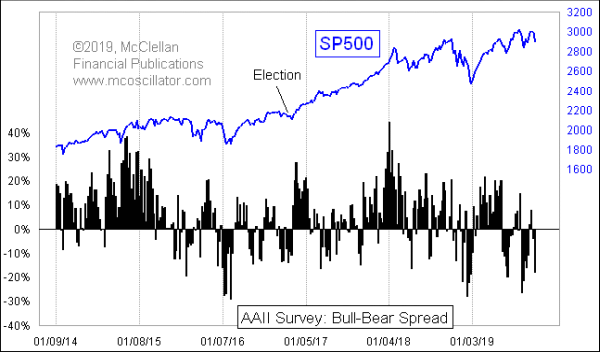
The American Association of Individual Investors (AAII) releases its weekly survey of its members’ every Thursday, and this week shows a pretty big spread between the bulls (21%) and the bears (39%). Another 39% of participants are “neutral”, and not willing to make a commitment about their opinion, and that’s actually a pretty high reading for the “neutrals”.
When investors shift over to saying that they are bearish in a pretty big way, it is usually a good marker for an intermediate term bottom for stock prices. Big spikes to the bullish side do not always work out the same way, as they can sometimes be seen at the initiation of a strong new uptrend, such as the one starting after the Nov. 2016 elections.
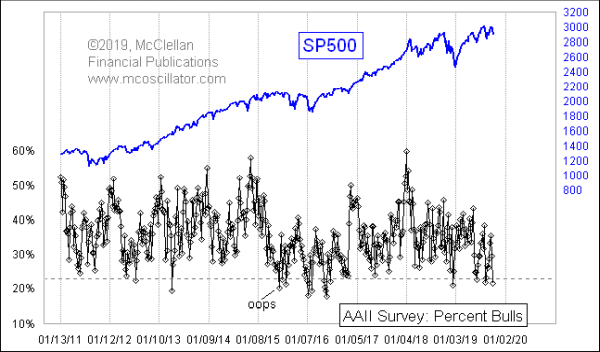
The Bull-Bear Spread is the most common way that technical analysts look at the AAII data, but it is not the only way to do so. One can look at the percentages for each category by themselves. Here is a chart showing just the percentage of bulls:

This week’s 21% reading is among the lowest of the last several years, and most of the time a very low reading like this will be a good marker of a price bottom. That does not always work, however, as the episode in mid-2015 demonstrates.
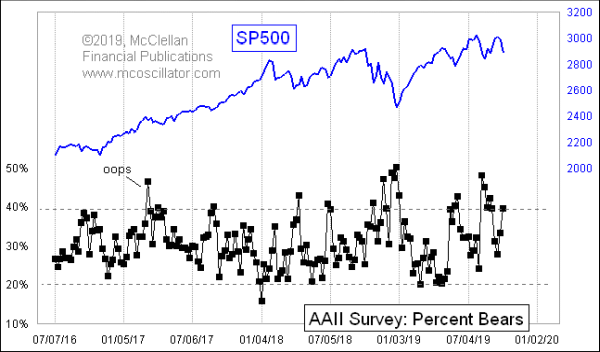
Here is a look at just the bears:

In this case, readings of around 40% or higher make for pretty good bottom indications, although there can be exceptions as we saw in March 2017 with an anomalous 46% bearish reading which did not bring a bottom.
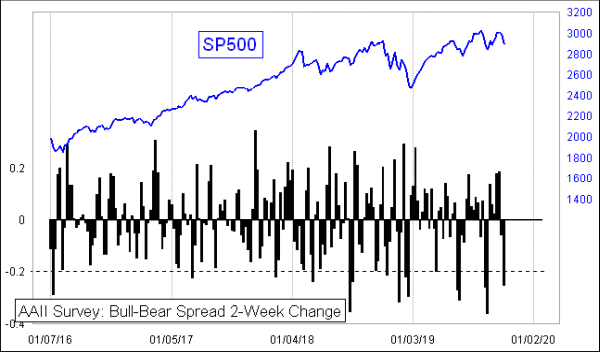
There is one additional way I like to look at these numbers, which is to see very sudden shift in the Bull-Bear Spread. I do that with a 2-week change, as shown in this next chart:

Note that this is not the same as a %ROC (rate of change) indicator you might use in a stock’s price. Rather, it is the raw numerical change in the spread, since we are already dealing with percentages. I have drawn a dashed line at the -0.2 level, which means minus 20 percentage points, and readings down below there tend to mark pretty good bottom indications for prices.
So here we are in the scary month of October, just following the scary month of September, and investors are following the script pretty well by saying that they are scared. Right on time for a nice seasonal bottom.
Tom McClellan
Editor, The McClellan Market Report
Apr 07, 2017
AAII Survey Readings Nearing A Bottom Indication |
Aug 15, 2019
Equity Put/Call Volume Ratio’s 21-Day MA |
Mar 14, 2019
Price = Sentiment |