Alarming Sign in NDX Stocks’ Drawdown

Free Chart In Focus email
Delivered to you every week
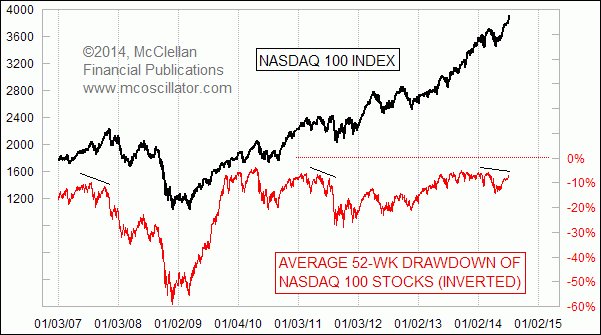
The Nasdaq 100 Index is making new multi-year highs, levels not seen since the weeks just after the 2000 Internet Bubble top. But it is interesting for us to see that the average component stock in that index is down 7% from its trailing 52-week high.
And that 7% drawdown number is actually smaller than it has been recently, but it is still not back to the low drawdown reading of 6.0% that we saw in early March, before the Nasdaq 100 stocks got into a patch of trouble. And the fascinating point is that divergences like this tend to be really important for the long-run picture for stock prices.
This current divergence is not guaranteed to stay with us. It looks like a genuine divergence now, but it is still possible that we could see a continued rally that takes the stocks in the Nasdaq 100 collectively up closer to the level of their 52-week closing highs, thereby closing the gap on this measure of average drawdown. But for now, the message is that the average stock making up the Nasdaq 100 Index is not confirming the bullish message of the NDX's higher price highs.
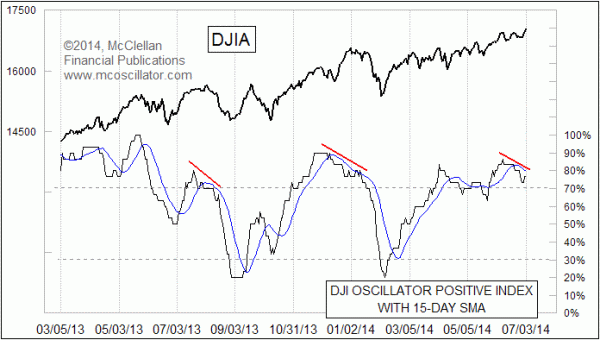
A similar message comes from a similar indicator, this time examining the 30 stocks which make up the DJIA.

This one looks at the 30 stocks that make up the DJIA, and checks each one to see if its Price Oscillator is above or below zero. What we are seeing lately is a declining number of Dow components participating in the uptrend that way, and a drop of this indicator below its 15-day moving average. This condition also comes as a divergence appears between prices and the indicator.
As with the NDX stocks' indicator above, the divergence does not absolutely have to persist; the market could just power through it, but that is not usually the way things usually work out.
As a final aside, I appeared on CNBC this week to discuss last week's Chart In Focus topic. You can see a portion of that interview at http://video.cnbc.com/gallery/?video=3000288767
Tom McClellan
Editor, The McClellan Market Report
Oct 11, 2013
New Highs’ Divergence |
Jan 06, 2012
DJI Oscillator Rising Index Signals Trouble |
Jul 28, 2011
NDX Stocks Show Troubling Drawdowns |