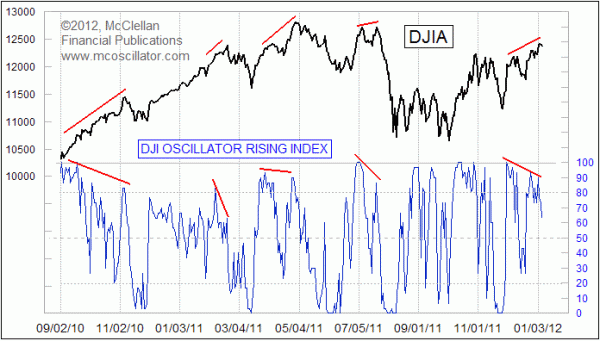
DJI Oscillator Rising Index Signals Trouble

Free Chart In Focus email
Delivered to you every week
In this week's chart, I take a look at an indicator which is featured in every issue of our Daily Edition. It looks at each of the 30 stocks which make up the Dow Jones Industrial Average (DJIA), and checks to see what percentage of them have a rising Price Oscillator.
A Price Oscillator is calculated similarly to the McClellan A-D Oscillator, except that instead of using the daily difference between Advances and Declines, we look at the closing price. See Calculating the McClellan Oscillator, and Calculating Indicators in Daily Edition Table. To get this composite indicator, I do 30 different Price Oscillator calculations, one for each of the 30 DJIA component stocks. Then I count how many of those Price Oscillators are rising.
Those 30 stocks which make up the DJIA are generally well correlated with each other, but there will be slight differences at times which can give us important information. That is what this indicator is designed to detect. If all of the DJIA stocks are trending higher, then most or all of them will see their Price Oscillators rise. Similarly, during a downtrending market, you can see a condition when most or all of them have a falling Price Oscillator, which takes this indicator down toward zero. Interestingly, by the time the market gets all of them moving together in either direction, the short term move is likely done, because a large amount of energy must be expended just to get the herd all moving together. So extreme readings above 80 or below 20 can show an overbought or oversold condition.
The interesting indication we are seeing right now in the chart is that the DJIA has been making higher price highs as 2012 begins, but the DJI Oscillator Rising Index is making a pattern of lower highs. This sort of divergence can be problematic, because it says that a smaller number of component issues are doing the work of pushing the index to a higher high.
Caution is warranted, however, because not every divergence like this turns immediately into a reversal for the stock market. It is merely describing a condition, and there is no guarantee that prices will roll over right away just because the participation in the rally is waning. Sometimes divergences like this can persist for several weeks before they finally matter. You can see a great example of that at the left end of the chart, when the DJIA kept on trending upward in spite of a divergent condition lasting several weeks. Eventually, though, that divergence did matter.
So right now, we cannot leap to any conclusions about the market's direction just because we see a divergence in this one indicator. But with other divergences already in place right now between stock prices and copper, and with the middle part of January normally a period of minor seasonal weakness, it is a concern to see this particular sign of waning participation in the advance.
Turning such warnings into more concrete guidance about trend changes is what we do in every issue of our Daily Edition. You can see samples, and sign up for a subscription at our Market Reports page. New subscribers can take advantage of a 14-day trial offer. If you have already been a subscriber or had the trial in the past, you can still take advantage of our normal pricing of $160/quarter, or $600/year, which is the same pricing that we started at in 1998 when it debuted as the "Daily Fax Edition". It has been a while since we sent our last fax issue.
If you are in the Houston, TX area, you may be interested to know that I will be coming to town for a pair of speaking engagements. On Friday, Jan. 13 at 10:00 AM, I’ll be speaking to the computer investing special interest group of HAL-PC, which is the Houston Area League of PC Users. HAL-PC’s web site, www.hal-pc.org, has location and other information.
On Saturday, Jan. 14 at 10:30 AM, I’ll be addressing the Houston Investors Association, http://houstoninvestors.com/wp/. They meet at the University Center on the University of Houston campus. Small special interest groups meet at 8:30 and 9:30, and my talk will begin at 10:30. Attendance is free for 1st time visitors.
Tom McClellan
Editor, The McClellan Market Report
Dec 30, 2011
Copper Weakness Is a Warning Sign |
Oct 21, 2011
McClellan Oscillator Confirms New Uptrend |
Aug 05, 2011
NDX Stocks Illustrate the Washout |