Californians Caused Late October Dip (and Rebound)

Free Chart In Focus email
Delivered to you every week
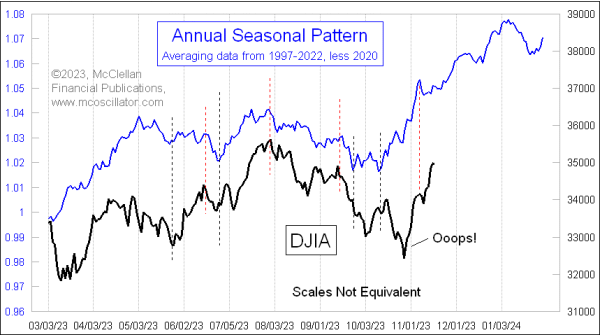
The stock market in 2023 has been tracking the Annual Seasonal Pattern (ASP) really closely, that is until a late October 2023 extra dip in stock prices that was not on the ASP's program. Since that dip, stock prices have been rallying hard to get back on track. But why did that dip happen?
Blame Californians. I wrote here back on July 21, 2023 about how the IRS had changed the tax filing and payment deadlines for most of California, because of flooding rains in January on previously burned areas that led to a lot of flooding. This led to disaster declarations, and a ruling by the IRS that taxpayers in 51 of California's 54 counties would get an extension to October 16, 2023 for filing their 2022 taxes. That extension also included a delay in having to pay any amounts owed for 2022, plus all quarterly estimated payments in 2023.
Because of this extension, smart Californians held onto their money and their tax returns until just before the deadline, presumably earning at least money market interest rates on it, but denying those tax dollars to Uncle Sam. California has 15% of the US population, but it also has more than its share of millionaires who have the wherewithal (and the accountants) to do this sort of tax planning.
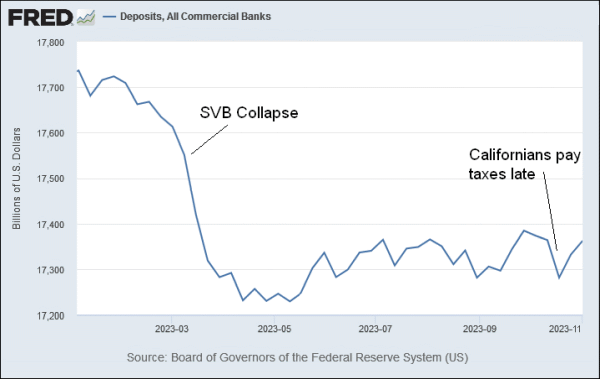
Why this relates to the stock market is that we have learned from the Fed's QE and QT episodes that having money in the banks is helpful for boosting stock prices. But when a bunch of Californians all wrote their tax payment checks to the IRS in October, that created a sudden drain in the liquidity pool. The result was an extra dip that the Annual Seasonal Pattern did not forecast.

Once those checks got cashed by the IRS, the money eventually found its way back into the banking system, resulting in a recovery for deposits in the commercial banks. And that helped to feed a recovery in the stock market, allowing prices to get back on track with the bullish phase of the Annual Seasonal Pattern.
We can see the effect of this in the tax collections data themselves, which are published in the Monthly Treasury Statement.

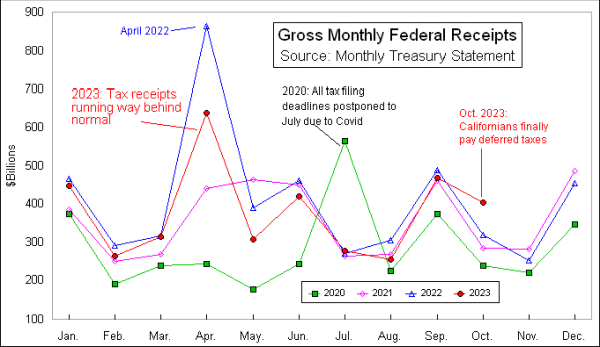
Much of 2023's monthly tax receipts data have been running behind 2022 levels. Part of that was due to 2022 being a down year for the stock market, so there were not as many capital gains to have to pay taxes on, and 2021 had a lot of capital gains tax payments because 2021 was a nice strong up year for the stock market.
We can see in this chart that the tax collections for October 2023 were much higher than past Octobers, and this is where that extension for California filers can really be seen. The Treasury Department and White House officials were quick to attribute October's strong tax collections to a supposedly improving economy, but it was really just a bunch of Californians taking advantage of the extension that was offered to them.
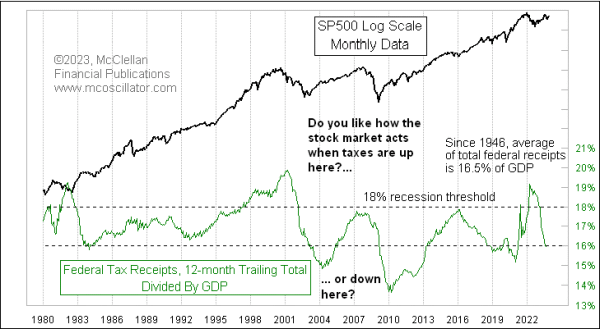
One positive for stock market investors is that even with October's more robust tax receipts, the U.S. government's total tax receipts are still pretty low as a percentage of GDP, and that is very bullish.

When taxes are running at 16% of GDP or less, the months that follow are historically very bullish for stock prices. By the same token, getting taxes up above 18% of GDP has brought an economic recession (and a bear market) every time it has happened. The mechanism for this is that by leaving a lot more money in the economy, the government is helping to allow that money to do things like lift stock prices. It is a bit of a problem for the escalating level of total federal debt, but that is a different problem.
Now that the California tax extension issue is behind us, the stock market can get back on the task of pushing itself higher as it usually does in November and December.
Tom McClellan
Editor, The McClellan Market Report
Jul 21, 2023
California Is Going to Drop a Liquidity Bomb on The Stock Market |
Aug 05, 2021
Taxes Too Darned High, Retarding The Economy |
Apr 20, 2018
3 Months Into Tax Relief, How It Is Going |