Crude Oil Says Stocks Heading for Unpleasant Time

Free Chart In Focus email
Delivered to you every week
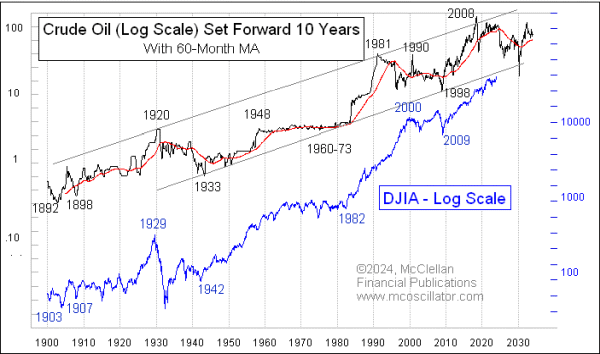
Years ago, I discovered the fun leading indication relationship shown in this week's chart, which reveals how the movements of crude oil prices tend to show up again as stock price movements about 10 years later. I do not have a good explanation for why this relationship works, but it has been working for the most part ever since the DJIA was first created back in 1896. At some point, when there is this much evidence, one can let go of the quest for the "why", and accept the "is".
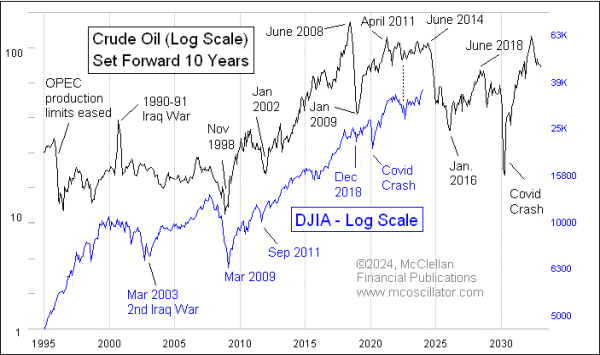
There are a couple of points to understand by anyone is going to employ this model. The first essential point is that the 10-year lag is not always precisely 10.0 years. Sometimes the stock market's actual turns vary from that ideal lag time by a few months. As an example, the price of crude oil bottomed in November 1998, and the corresponding stock market bottom was in March 2009, which was 5 months longer than the ideal 10-year lag time.
Another important point is that the magnitudes of crude oil's movements do not necessarily get echoed by the stock market. This model is more about the timing of the turns than the severity of them.
Occasionally an exogenous event can come along and disrupt things. The March 2020 Covid Crash is not something which crude oil appears to have known was coming, but after that event the major averages worked extra hard to get back on track. There was also the 1990-91 instance when oil prices briefly doubled after Iraq attacked Kuwait, then collapsed back down again to their prior price levels. Stocks did not echo that anomalous spike.
This relationship between oil prices and stock prices is important all the time, but especially so this year, because of what happened to oil prices 10 years ago. Back in 2014, the fracking boom in the U.S. was underway, and OPEC was trying to cut output to keep prices up in spite of that big new supply. OPEC gave up that fight in the summer of 2014, and oil prices fell hard. Here is another chart of that same relationship shown above, but zoomed in to better see the recent years.

Oil prices fell off a cliff between June 2014 and January 2016. That would mean a big decline for the stock market between June 2024 and January 2026, if the 10-year lag time continues to work as it has worked for more than a century.
What we do not know is what the magnitude of such a move in the stock market might be, because magnitudes do vary. Stock prices in 2018 did echo the big oil price crash that was part of the collapse of the generalized commodities bubble in 2008, but it was a much more quiet down move in stocks during 2018. The December 2018 bottom was almost exactly 10 years after the January 2009 crude oil bottom. Magnitudes can also vary the other way; the enormous bear market of 1929-1932 unfolded on schedule, echoing the collapse of the Texas oil boom which unfolded starting in 1920. But the stock market fell much harder than oil had suggested.
I feel pretty confident, based on this model, in expecting that the period between June 2024 and January 2026 is not going to a great time for the stock market, and also not great for whoever wins in the November 2024 elections. But I do look forward to the big bull market which this model says is coming between 2026 and 2028.
Tom McClellan
Editor, The McClellan Market Report
Jun 30, 2020
Crude Oil 10-Year Lead Update |
Aug 30, 2019
Crude Oil’s 10-Year Message |
May 31, 2018
Waiting on the Echo of Crude Oil’s Big Drop |