Deja Voodoo, 1994 Edition
Free Chart In Focus email
Delivered to you every week
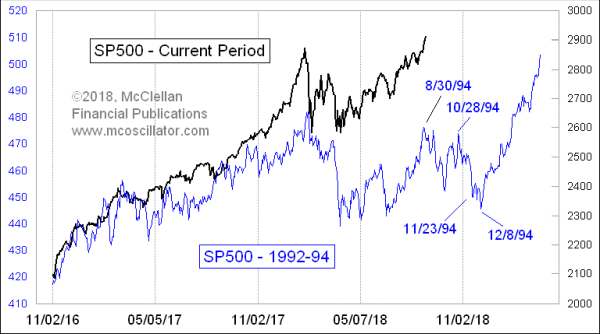
In the election of 1992 there was an insurgent candidate, who did not win a majority of the popular vote, but who took the White House and set about reorganizing the government in a manner more to his liking. The first two years of his term in office were marked by numerous scandals, and by a stock market which saw a scary dip in the 2nd year which eventually resolved itself into a strong uptrend during the 3rd year of his presidential term. At that time, the Federal Reserve was commencing a program of rate hikes, which had market participants worried.
Does this sound familiar?
This week’s chart compares the SP500 in the current time frame to what happened during the first 2 years of President Clinton’s first term. The politics of President Clinton and President Trump are assuredly different, or at least that is true as of today. NAFTA got settled in January 1994, and now its renegotiation is not taking place at exactly the right time in the rhyme and meter of history.
But yet what is important for our purposes here is that the stock market’s response in each period is greatly similar.
In August 1994, the SP500 did not make a higher high than its Feb. 2, 1994 price high, but the resemblance of the price pattern to the current pattern is unmistakable. There was an initial down move in February 1994, followed by a minicrash to a bottom April 4, 1994. In the current rerun, the final bottom was on April 2, 2018. Close enough for government work.
August 1994 was a strong month for the SP500. It was not strong enough to produce a higher closing high than Feb. 1994, but it was still a robust swoop upward that pulled in a lot of investors.
August 2018 has been a strong month for the SP500, seeing it eke out a slightly higher closing high for that index, but not for the DJIA nor the NYSE Composite. We are now at the equivalent point to the Aug. 30, 1994 peak which led to a 3-wave decline to a December 1994 low.
Nothing says that the stock market in 2018 has to continue following this pattern. But then nothing had said it would do such a good job following that pattern up until now. If the pattern resemblance continues, then we are in for a rough and choppy 3 months, and then a really robust rally into 2019. If…
Tom McClellan
Editor, The McClellan Market Report
May 18, 2018
What Happened to the Presidential Cycle? |
Jun 08, 2017
The Unexplainable 4-Year Rerun |
Aug 09, 2018
How Seasonality Has Changed |