Deserved or Not, T-Bonds Are Set Up For A Rally

Free Chart In Focus email
Delivered to you every week
There are lots of investments that are undeserving of investors' money, and T-Bonds are at the top of the list. Even though the principal is guaranteed by Uncle Sam's (or Uncle Ben's) ability to print new money, the current yield on even the longest duration bonds is still at roughly the same level as the inflation rate. So any interest you earn on your money gets eaten up by the loss in value of that money due to the Fed's unwillingness to do its job and achieve price stability.
But in the financial markets, whether or not an investment is "deserving" often bears very little on whether people will invest in it. Logic is not mandatory.
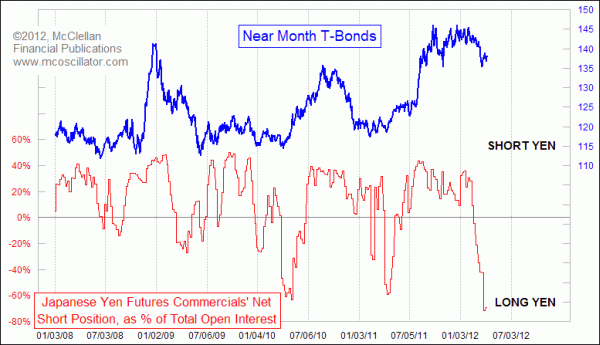
This week's chart makes the statement that T-Bond prices are headed higher, and it does so in a roundabout sort of way. In the upper portion of the chart is the price plot of T-Bonds (continuous near month contract). The lower plot shows an indicator derived from data in the CFTC's weekly Commitment Of Traders (COT) Report. But rather than look at the data on T-Bonds themselves, which can sometimes give wishy-washy information, here we are looking at the commercial traders' net position in the Japanese yen.
Commercial traders are the "big money" traders who hold large positions. How large is "large" differs among the various futures contracts, and the CFTC sets out the rules for those determinations. Because the commercial traders are the big money, the presumption is that they are also the "smart money".
Right now, commercial traders of Japanese yen futures are holding a really big net long position. That means they think that the yen will go up in value versus the dollar, and so they have positioned themselves to profit from that expected move.
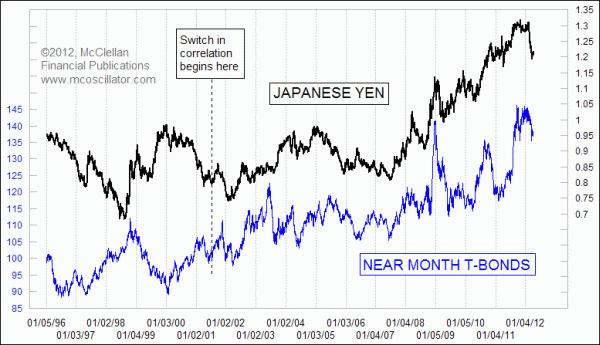
The whole reason why this is relevant for T-Bond prices is that there is a really strong positive correlation between T-Bond prices and the Japanese yen. But this has not always been so. The chart below shows that relationship, and you can see that before about mid-2001, it used to be an inverse relationship. Somebody flipped a switch in 2001, and now it is a strong positive correlation.

So because the yen does pretty much what T-Bond prices do, at least in terms of the direction of travel, we can make reasonable inferences about what lies ahead for bond prices by looking at what lies ahead for the yen. When the commercial traders are holding their biggest net long position in Japanese yen futures in several years, the implication is pretty strong that the yen should head higher in the coming weeks. And as the yen heads higher, T-Bonds ought to tag along, whether they deserve to go up or not.
Given what we have learned from another borrowed COT Report relationship, that positive period for T-Bonds is not likely to last beyond early June. The inverse relationship between T-Bond price and stock prices is still working very well, so the opportunity for T-Bond prices to advance should only last as long as stocks are in a corrective mode, and that corrective mode is scheduled to be finished by early June.
If you are interested in learning more about what the COT data can tell us, I feature an analysis of the relevant COT data every Friday in our Daily Edition.
Tom McClellan
Editor, The McClellan Market Report
Feb 03, 2012
Eurodollar COT Indication Calls For Big Stock Market Top Now |
Nov 11, 2011
Borrowing An Indicator |
Apr 29, 2011
Copper and the Commitment of Traders Report |