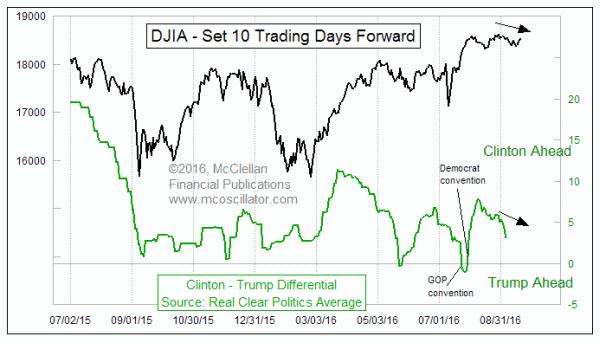
DJIA Leads Poll Numbers

Free Chart In Focus email
Delivered to you every week
We can see ahead of time which way the poll numbers are going to swing by looking at the stock market.
This is a phenomenon I have been tracking since the 2000 election, when I started gathering poll data and comparing it to the movements of the stock market. I found out then that the movements of the DJIA were showing up a week later in the Gallup and Zogby poll numbers for the presidential race.
This discovery allowed me to make one of the most accurate calls I have ever made in 21 years in this business. On the Thursday before the 2000 election, when then-Governor George W. Bush was up by 6 percentage points in the polls, I predicted in our twice monthly newsletter that the election would be “too close to call”. And indeed for 6 weeks after the election, it indeed was too close to call.
What I knew then was that there had been a rally in the DJIA just before the election, and that the echo of that rally had not shown up yet in the poll numbers. I could see that the movements of the DJIA had a lagged reaction in the poll numbers, and so the poll readings taken the week before the 2000 election did not fully reflect the swing in the public’s mood that had already taken place, which the stock market can more immediately reflect, but which had not yet shown up in the poll numbers. That change did show up in the actual vote totals, though.
For more of the history of this relationship see this Special Report. See also the video of my CNBC appearance on this same topic.
The phenomenon is working again this time, as movements higher for stock prices show up again several days later as the poll numbers swing in favor of the incumbent party candidate. Movements downward for stock prices reflect a souring of the public’s mood, and that shows up after a lag time as a shift toward the challenger party candidate.
Gallup and Zogby have dropped out of the presidential polling business, but many others have risen up in their places. You can see the extensive list of all the different polling firms tracked by the web site www.realclearpolitics.com (RCP) and published at this link. Because a lot of polling firms include data from polls taken over a period of several days, there is now more of a lag in the response of poll numbers to the stock market’s movements. RCP adds its own additional lag by virtue of looking at the last several poll releases, and the result is that it is now about a 10 trading day lag from what stock prices do versus 5-6 trading days in 2000 and 2004. That is just what we have to deal with, since I have neither the time, the money, nor the inclination to conduct my own polling.
The chart above shows a reliable phenomenon that happens every 4 years wherein there are skews in the poll numbers surrounding the times of the Republican and Democratic conventions. We are now moving out of the convention turbulence and into the clear air of the time period after the conventions, and the polling data are settling down and once again following the movements of the DJIA.
In the weeks to come leading up to the Nov. 8 election, we can reasonably expect that the poll numbers are going to follow the DJIA even more closely. The decline over the past 3 weeks has led to the recent swing in the poll numbers in favor of Mr. Trump, and that swing appears to have a bit more to go.
This sets up the curious and potentially conflicted notion (for some) that one might wish for a certain election outcome and at the same time a certain stock market outcome. But to get a Trump victory, the data say that we should require a stock market decline into November. And if one is bearish, and troubled by the current overvaluation among many measures then expecting a Clinton victory is problematic. It all comes down to what you are rooting for.
I plan to follow this relationship and report on it in our twice monthly McClellan Market Report and our Daily Edition in the weeks leading up to the election.
Tom McClellan
Editor, The McClellan Market Report
Aug 12, 2016
Quietest Range In 2 Decades |
Nov 02, 2012
My Final Pre-Election Forecast |
May 26, 2016
El Niño, La Niña, & The Stock Market |