My Final Pre-Election Forecast

Free Chart In Focus email
Delivered to you every week
Two weeks ago I shared with you some interesting charts that showed the interrelationship of the stock market and the polling data. This is something that we have used for each of the past 3 presidential elections to correctly forecast the outcome of the popular vote. It was a particularly interesting method of analysis back in 2000, when then-Gov. Bush was leading by 6 points on the Friday before the election, but we said that the election that year would be "too close to call". Indeed, it was too close to call for about 6 weeks.
The basic idea that has worked on each of the last 3 presidential elections is that a rally in the stock market tends to get echoed about a week later as a bump in the polls for the incumbent party candidate. So at that election back in 2000, what we knew that the rest of the country did not know was that the poll numbers just before the election had not yet reflected a big rally in stock prices.
My theory about this is that both the stock market and the polling numbers are a reflection of public mood. If the public is in a bad mood, then they tend to sell their stocks, and they also tend to not like the guy who is in the White House. If mood improves, then they bid up stock prices, and they like the president (or his party) more.
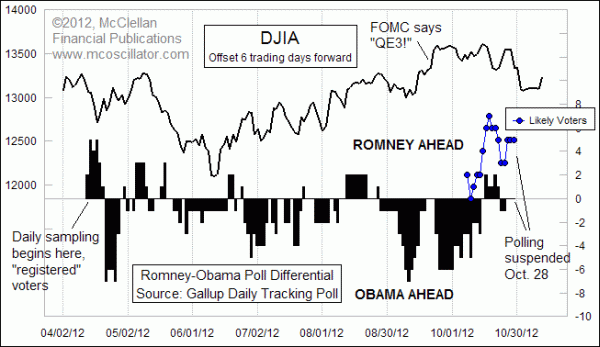
But it is all working backwards this year, as this week's chart helps to illustrate. This time, market rallies seem to help Governor Romney a week later, and selloffs seem to move the poll numbers in President Obama's favor. I do not have a good theory to explain why it is working backwards this time; I just am seeing what's happening.
The chart above shows data from the Gallup Poll, and one interesting point right now is that Gallup has not updated its poll numbers since Oct. 28, due to the damage from Hurricane Sandy. In an explanation on the firm's web site, Gallup's Editor In Chief Frank Newport states, "Basically, we reached the conclusion that Superstorm Sandy had compromised the ability of a national survey to provide a nationally representative assessment of the nation’s voting population."
So we cannot know exactly what is happening in the poll numbers this week, but we can make a reasonable inference that if the numbers were available, they would have shown a decay in the lead that Governor Romney once held in Gallup's "likely voters" series. It is worth pointing out that Gallup's Daily Tracking Poll started showing the numbers for "registered voters" back in April 2012, but did not include the more tightly filtered category of "likely voters" until Oct. 7.
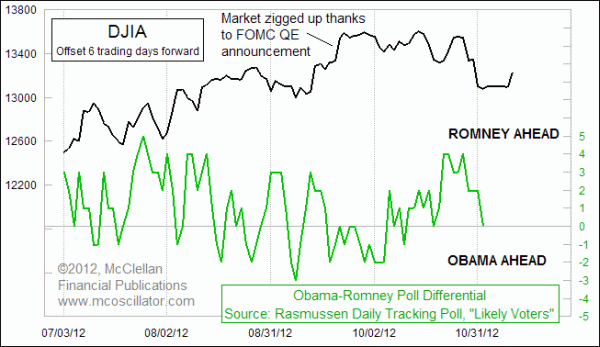
Rasmussen has continued its poll reporting throughout the storm aftermath, featuring "likely voters" throughout the polling history. Rasmussen's numbers do show that the race has tightened to a dead heat, which is just what the drop in the DJIA to its Oct. 24 bottom said should happen.

Now that we have the stock market back open again after the two-day closure due to Hurricane Sandy, we can once again receive its information about how the poll numbers should move after that one-week delay. But now we have a new problem, which is that the stock market has not really traded "normally" in the wake of Hurricane Sandy. So how good is its leading indication for the poll numbers? That's a tough question to answer.
We did see a big up day on Thursday, November 1, 2012. So was that the rally which our predictive work said was supposed to have happened earlier, and which was just delayed by the NYSE closure? Or is it a rally that happened when it was supposed to, and which would thus not be felt until a week later, which would be after the election. These are interesting questions.
Into that whole milieu of swirling facts and doubts, there is one more item to consider when forecasting how the election is going to turn out. Usually I use this relationship of the stock market and the poll numbers to forecast what the popular vote will do, but the popular vote this year could see a big effect on voter turnout from Hurricane Sandy. The electoral college vote is unlikely to be affected, since the most hard-hit states were along the east coast where President Obama still has a strong state-by-state lead. So even if fewer voters from New York and New Jersey turn out to vote, those states will still contribute the same number of electoral college delegates that they would if the turnout were higher. But counting up all of the individual votes toward the national popular vote total could indeed see an effect.
So given all of these factors together, here is my best guess: I am projecting a 2 point margin of victory for Governor Romney in the nationwide popular vote. What that means for the electoral college count, and thus the actual election, is a wholly different piece of analysis, about which other analysts are more capable than I am of handicapping the state by state results.
Tom McClellan
Editor, The McClellan Market Report
Oct 19, 2012
Market and Polling Not Following the Typical Pattern |
Nov 05, 2010
Entering the 3rd Presidential Year |
Apr 16, 2010
Presidential Cycle Shows April Top |